OPEN-SOURCE SCRIPT
Indicator: Forecast Oscillator & a BB extrapolation experiment
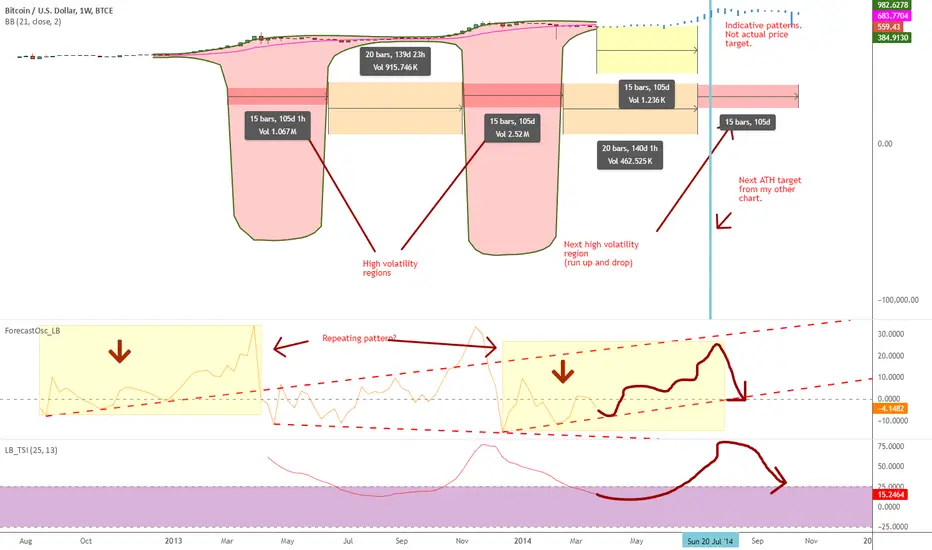
FOSC (Forecast Oscillator, %F) is implemented as explained by Kaufman (there are lot of representations out there, using linregs, this one is not.).
This indicator plots a 3-period smoothing of %F. When %F = 0, the trend line and prices are moving parallel to one another; when %F is above 0 the market is accelerating away from the trend line; when %F is below 0 prices are slowing down and the two series are converging.
Now on to the BB extrapolation: As you can see above, a 21-period BB on 1W shows 2 volatile areas of same length. Simple projection using the same time periods gives us a similar volatile area in another 105d. FOSC is forming a similar pattern now as of the first area. More information in the chart markings.
Interesting thing for me was how my other chart (tradingview.com/v/HeSyTev8/) aligned with this. Lets see how far these timelines are respected.
In the mean time, feel free to "Make mine" this and use FOSC in your charts. Appreciate any feedback / comments.
Script de código aberto
Em verdadeiro espírito do TradingView, o criador deste script o tornou de código aberto, para que os traders possam revisar e verificar sua funcionalidade. Parabéns ao autor! Embora você possa usá-lo gratuitamente, lembre-se de que a republicação do código está sujeita às nossas Regras da Casa.
List of my free indicators: bit.ly/1LQaPK8
List of my indicators at Appstore: blog.tradingview.com/?p=970
List of my indicators at Appstore: blog.tradingview.com/?p=970
Aviso legal
As informações e publicações não se destinam a ser, e não constituem, conselhos ou recomendações financeiras, de investimento, comerciais ou de outro tipo fornecidos ou endossados pela TradingView. Leia mais nos Termos de Uso.