UpDown RSI+Divergence [DivineTrade]
English version below
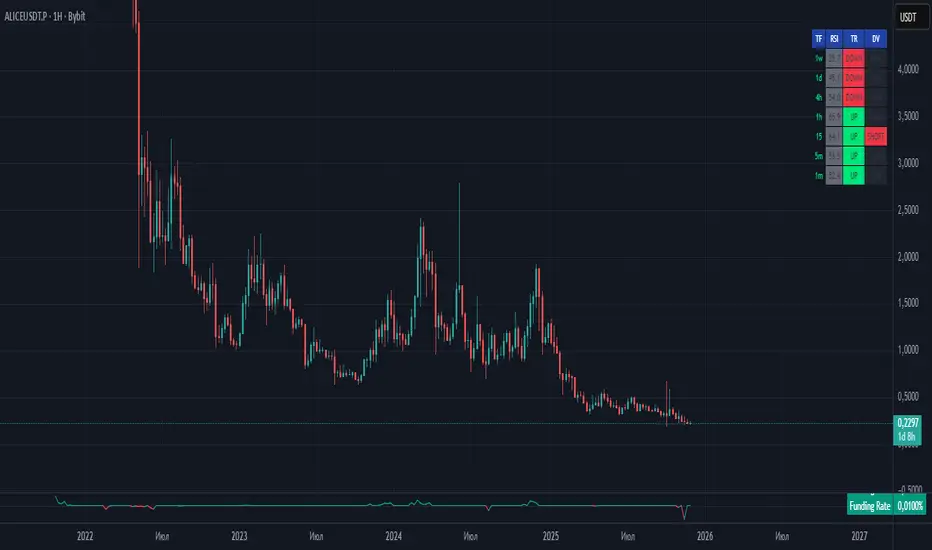
Этот индикатор собирает ключевую информацию по RSI и дивергенциям сразу на нескольких таймфреймах и выводит её в компактную таблицу прямо на графике. Он рассчитывает RSI и дивергенции внутри каждого таймфрейма отдельно, поэтому данные остаются точными и одинаковыми вне зависимости от того, какой ТФ у вас открыт.
Индикатор показывает систему из семи таймфреймов: 1m, 5m, 15m, 1h, 4h, 1d, 1w.
Для каждого отображается:
• RSI значение с цветовой маркировкой зон
красный — перегрев выше 83
желтый — активный рост от 70 до 83
серый — нейтральная зона 30–70
зелёный — перепроданность ниже 30
• Наличие дивергенции RSI:
LONG — бычья дивергенция
SHORT — медвежья дивергенция
NaN — дивергенции нет
Дивергенции используются подтверждённые, на основе пивотов цены и RSI. Это позволяет исключать случайный шум и делать сигналы более надёжными.
Индикатор подходит для тех, кто использует анализ RSI, торгует по откатам, разворотам или комбинирует младшие ТФ с более старшими. Таблица обновляется в реальном времени и позволяет быстро понять общую картину по рынку и увидеть, где формируется слабость или сила тренда.
_____________________________________________________________________
Description (EN)
This indicator collects key RSI and divergence data across multiple timeframes and displays it in a compact on-chart panel. RSI and divergence calculations are performed within each timeframe independently, ensuring accurate and consistent results regardless of which timeframe you have open on the chart.
The indicator monitors seven timeframes: 1m, 5m, 15m, 1h, 4h, 1d, 1w.
For each timeframe it displays:
• RSI value with color-coded zones:
red — overbought above 83
yellow — rising momentum between 70 and 83
gray — neutral range 30–70
green — oversold below 30
• RSI divergence signal:
LONG — bullish divergence
SHORT — bearish divergence
NaN — no divergence detected
Divergences are based on confirmed price and RSI pivots, which helps remove noise and makes the signals more reliable.
This tool is useful for traders who rely on RSI analysis, trade reversals or pullbacks, or want to monitor momentum alignment across different timeframes. The panel updates in real time and provides a quick view of market strength, weakness, and emerging divergence opportunities across all major time horizons.
Script sob convite
Somente usuários aprovados pelo autor podem acessar este script. Você precisará solicitar e obter permissão para usá-lo. Normalmente, essa permissão é concedida após o pagamento. Para obter mais detalhes, siga as instruções do autor abaixo ou entre em contato diretamente com markdn1678.
A TradingView NÃO recomenda pagar ou usar um script, a menos que você confie totalmente em seu autor e entenda como ele funciona. Você também pode encontrar alternativas gratuitas e de código aberto em nossos scripts da comunidade.
Instruções do autor
Aviso legal
Script sob convite
Somente usuários aprovados pelo autor podem acessar este script. Você precisará solicitar e obter permissão para usá-lo. Normalmente, essa permissão é concedida após o pagamento. Para obter mais detalhes, siga as instruções do autor abaixo ou entre em contato diretamente com markdn1678.
A TradingView NÃO recomenda pagar ou usar um script, a menos que você confie totalmente em seu autor e entenda como ele funciona. Você também pode encontrar alternativas gratuitas e de código aberto em nossos scripts da comunidade.