OPEN-SOURCE SCRIPT
[SK] RSI/CCI Correlating Oscillator
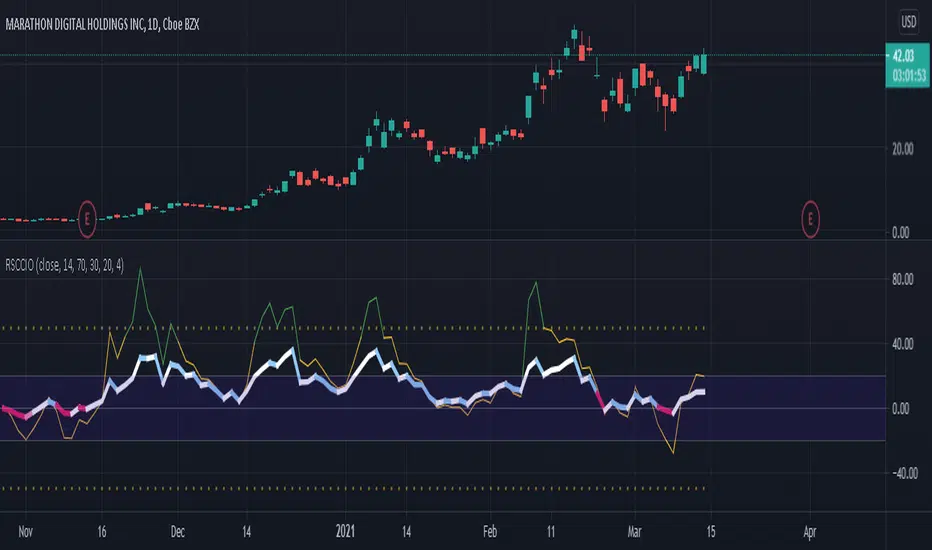
The combination of RSI and CCI can be a powerful tool to efficiently signal the strength of the trend and upcoming reversals.
The magic comes when you're able to correlate both indicators correctly, this is the power I give you with the RSCCIO.
I've added additional features to each indicator that make signals more clear and easier to identify.
On the RSI
On the CCI
---
RSI Relative Strength Index
The RSI is a momentum indicator that measures the magnitude of recent price changes. An asset is usually considered overbought when the RSI is above 70% and oversold when it is below 30%.
CCI Commodity Channel Index
The CCI was originally developed to spot trend changes. Use the CCI on the longer-term chart to establish the dominant trend and on the shorter-term chart to isolate pullbacks and generate trade signals.
The magic comes when you're able to correlate both indicators correctly, this is the power I give you with the RSCCIO.
I've added additional features to each indicator that make signals more clear and easier to identify.
On the RSI
- Directional color coding similar to what you can find on a MACD. This helps to identify the general trend ( above or below midline ) and the of the movement within.
- For precise correlation the RSI is adjusted to a midline of 0. You can still enter the overbought/oversold levels as you'd expect on a regular RSI and it will be automatically adjusted.
On the CCI
- Extreme strength / weakness color coding when the value exceeds the range makes signals more clear.
- For precise correlation with the RSI, we need to scale down the value of the CCI with the Sensitivity Input. The default value works overall but feel free to play around to adjust the scale of the CCI movement.
---
RSI Relative Strength Index
The RSI is a momentum indicator that measures the magnitude of recent price changes. An asset is usually considered overbought when the RSI is above 70% and oversold when it is below 30%.
CCI Commodity Channel Index
The CCI was originally developed to spot trend changes. Use the CCI on the longer-term chart to establish the dominant trend and on the shorter-term chart to isolate pullbacks and generate trade signals.
Script de código aberto
Em verdadeiro espírito do TradingView, o criador deste script o tornou de código aberto, para que os traders possam revisar e verificar sua funcionalidade. Parabéns ao autor! Embora você possa usá-lo gratuitamente, lembre-se de que a republicação do código está sujeita às nossas Regras da Casa.
Aviso legal
As informações e publicações não se destinam a ser, e não constituem, conselhos ou recomendações financeiras, de investimento, comerciais ou de outro tipo fornecidos ou endossados pela TradingView. Leia mais nos Termos de Uso.