OPEN-SOURCE SCRIPT
Atualizado ASG Delta %
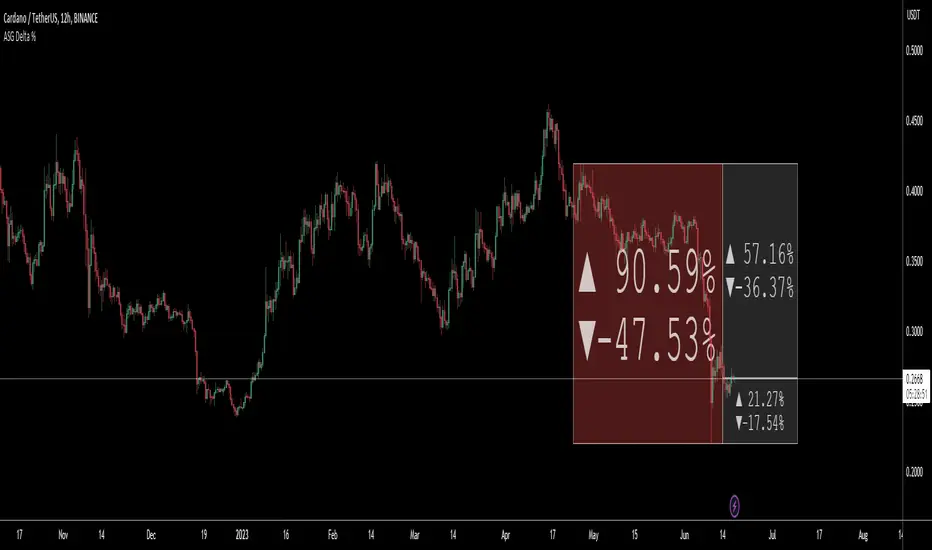
This utility script provides a convenient way to calculate the percentage gain or drop of a token's price within a user-defined date range. It eliminates the need for manual measurement on individual charts, saving time and effort.
The script is particularly valuable when integrated into a daily token scanning routine for watchlists. By comparing the significant gains or drops among different tokens, traders can identify potential trading opportunities.
Simply select the desired date range, and the script will identify the highest and lowest price points achieved during that period. It then shows a visual representation in the form of a bullish or bearish box, displaying the percentage change (delta %). If the current price falls within the box's upper and lower bounds, additional percentage information can be shown in either the 'normal' or 'reverse' mode.
For instance, if a token experiences a -52.35% drop, enabling the 'Reverse' setting will reveal a potential 109.86% gain (from the low), or a 76.02% gain (from current price) or a potential drop of -16.5% (from current price) etc.. Having these basic statistics available, without having to manually chart them, especially during prolonged bear or bull markets, enables traders to make informed decisions and position themselves for more profitable trades.
I hope you find this script valuable. Your comments and recommendations are welcome as they will help improve the script's functionality further.
Notas de Lançamento
1. Made some modifications to display both 'normal' and 'reverse' percentage changes at the same time2. Added some 'style' changes like "[BOX]" to display the extra deltas within a Box background - this allows the internal text to auto-resize
3. Some minor mods to allow you to display "arrows" or "%" signs if desired
4. Streamlined code
Script de código aberto
Em verdadeiro espírito do TradingView, o criador deste script o tornou de código aberto, para que os traders possam revisar e verificar sua funcionalidade. Parabéns ao autor! Embora você possa usá-lo gratuitamente, lembre-se de que a republicação do código está sujeita às nossas Regras da Casa.
Aviso legal
As informações e publicações não se destinam a ser, e não constituem, conselhos ou recomendações financeiras, de investimento, comerciais ou de outro tipo fornecidos ou endossados pela TradingView. Leia mais nos Termos de Uso.