OPEN-SOURCE SCRIPT
Atualizado MACD Multi-Timeframe Indicator
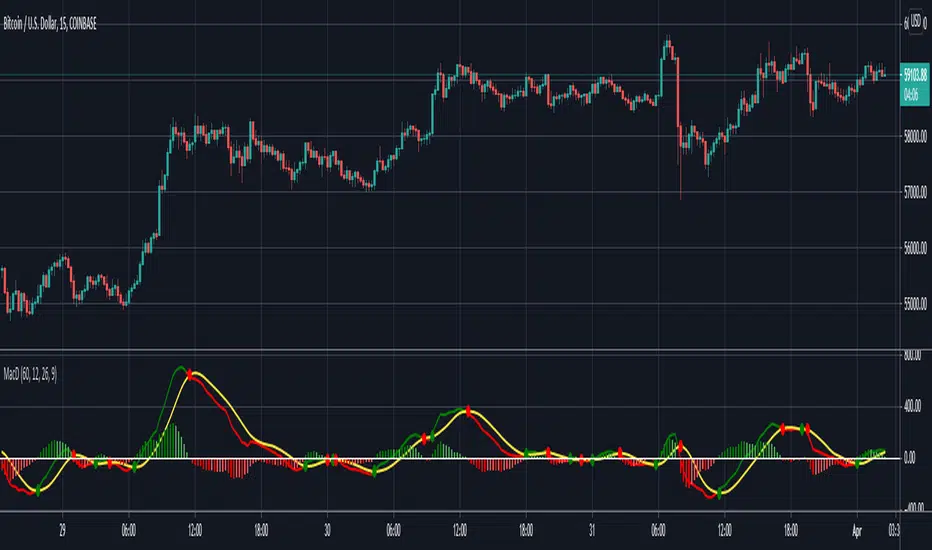
Hello everyone, this is indicator has always been my go-to MACD indicator for many years. It is such a beautiful easy to understand indicator. You can also view different timeframe resolutions which is helpful. When the MACD crosses up the signal line it is green, and when it crosses below the signal line it is red. The signal line is the constant yellow line. MACD histogram is dark green when increasing buying momentum, and you'll see the green get lighter when buy momentum is decreasing. As well, MACD histogram is dark red when increasing sell momentum, and you'll see the red get lighter when sell momentum is decreasing. I hope you guys love this macd design. Happy trading!
The MACD indicator can be used in many ways but my favorite way to use MACD by itself is by going long when macd < 0 & macd crosses above signal line, and going short when macd > 0 & macd crosses below signal line. I added those alerts for anyone interested.
The MACD indicator can be used in many ways but my favorite way to use MACD by itself is by going long when macd < 0 & macd crosses above signal line, and going short when macd > 0 & macd crosses below signal line. I added those alerts for anyone interested.
Notas de Lançamento
I updated the script to version 5 and made the source code more readable to the community.Notas de Lançamento
I fixed the MACD colors so they are more noticeable when MACD momentum is strong or weak.Script de código aberto
Em verdadeiro espírito do TradingView, o criador deste script o tornou de código aberto, para que os traders possam revisar e verificar sua funcionalidade. Parabéns ao autor! Embora você possa usá-lo gratuitamente, lembre-se de que a republicação do código está sujeita às nossas Regras da Casa.
Aviso legal
As informações e publicações não se destinam a ser, e não constituem, conselhos ou recomendações financeiras, de investimento, comerciais ou de outro tipo fornecidos ou endossados pela TradingView. Leia mais nos Termos de Uso.
Script de código aberto
Em verdadeiro espírito do TradingView, o criador deste script o tornou de código aberto, para que os traders possam revisar e verificar sua funcionalidade. Parabéns ao autor! Embora você possa usá-lo gratuitamente, lembre-se de que a republicação do código está sujeita às nossas Regras da Casa.
Aviso legal
As informações e publicações não se destinam a ser, e não constituem, conselhos ou recomendações financeiras, de investimento, comerciais ou de outro tipo fornecidos ou endossados pela TradingView. Leia mais nos Termos de Uso.