OPEN-SOURCE SCRIPT
Atualizado Mayer Multiple

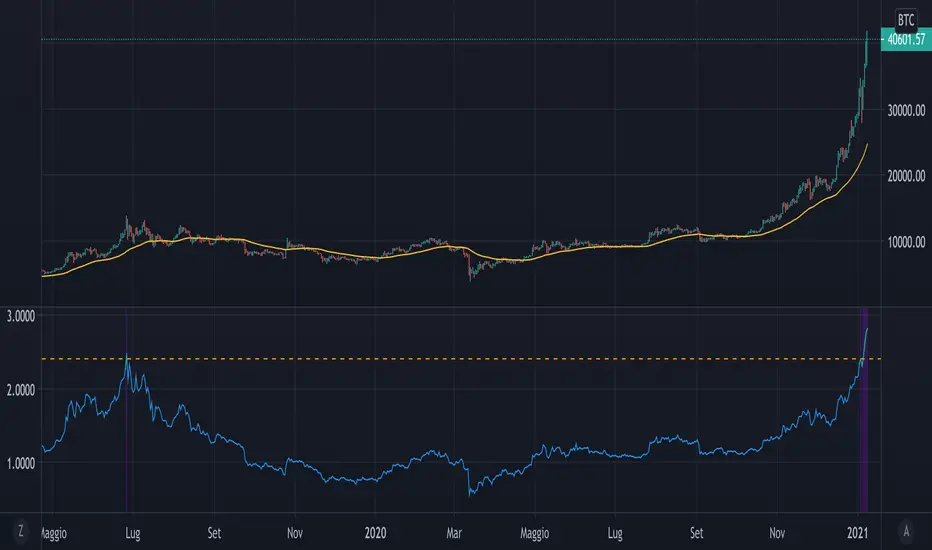
The script implements a custom version of the Mayer multiple and it may be useful for analyzing the price of Bitcoin in a historical context.
Note n.1: Mayer multiple does not tell whether to buy, sell or hold, but highlights the best long-term area when the bitcoin price is below a threshold value (2.4).
Note n.2: the threshold value (2.4) has been determined in the past by simulations performed.
The script user may decide whether to use the shown graph or another graph for the calculation of the Mayer multiple.
The script is very easy to use and it is possible to change the following parameters:
- the period of SMA (default value is 200)
- the threshold (default value 2.4)
- Show or not the sell area
- Use or not the shown graph to calculate the Mayer multiple (default value is true)
- name of exchange to use for calculation of the Mayer multiple (default value is BNC)
- name of chart to use for calculation of the Mayer multiple (default value is BLX)
Notas de Lançamento
- Added the alert conditions. Remember: the alertcondition statement does not start alerts but creates the conditions. The alerts must always be created manually in the Create Alert dialog box.
- Changed the precision of graph (from 2 to 4).
Notas de Lançamento
Modified the title script.Notas de Lançamento
- Modified the alert conditions name.
- The Mayer multiple's graph is now plotted in another panel.
Notas de Lançamento
Improved the code readability.Script de código aberto
Em verdadeiro espírito do TradingView, o criador deste script o tornou de código aberto, para que os traders possam revisar e verificar sua funcionalidade. Parabéns ao autor! Embora você possa usá-lo gratuitamente, lembre-se de que a republicação do código está sujeita às nossas Regras da Casa.
Aviso legal
As informações e publicações não se destinam a ser, e não constituem, conselhos ou recomendações financeiras, de investimento, comerciais ou de outro tipo fornecidos ou endossados pela TradingView. Leia mais nos Termos de Uso.
Script de código aberto
Em verdadeiro espírito do TradingView, o criador deste script o tornou de código aberto, para que os traders possam revisar e verificar sua funcionalidade. Parabéns ao autor! Embora você possa usá-lo gratuitamente, lembre-se de que a republicação do código está sujeita às nossas Regras da Casa.
Aviso legal
As informações e publicações não se destinam a ser, e não constituem, conselhos ou recomendações financeiras, de investimento, comerciais ou de outro tipo fornecidos ou endossados pela TradingView. Leia mais nos Termos de Uso.