OPEN-SOURCE SCRIPT
Atualizado Peak and Trough Tracker by Mustafa KAPUZ
Peak and Trough Tracker
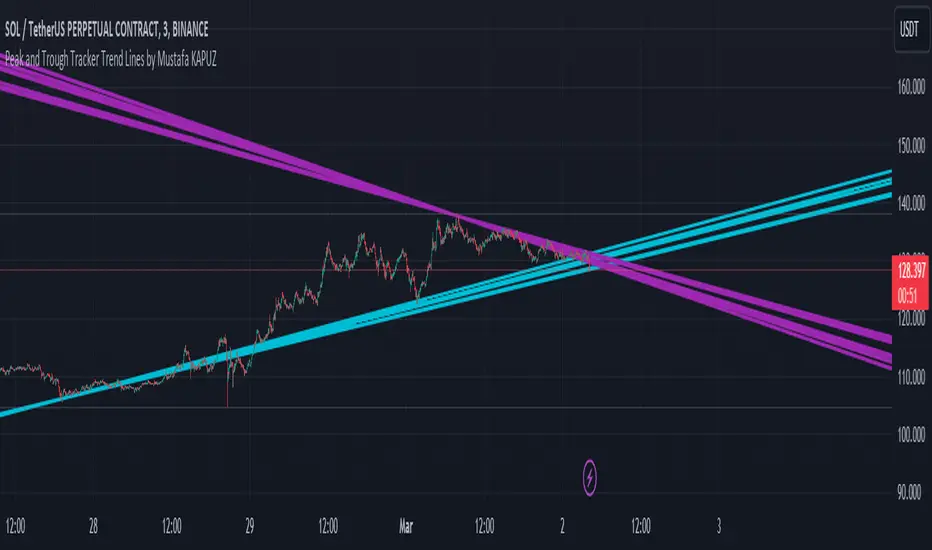
This indicator identifies the highest and lowest prices reached in two user-defined time periods. It then draws two lines connecting these peak and trough points. The purple line represents the connection between the highest prices, while the aqua line represents the relationship between the lowest prices. Both lines extend into the future and past, providing insights into potential support and resistance levels.
How to Use:
This tool helps visually understand the market's key turning points and adjust your investment strategy based on these insights.
Zirve ve Dip Noktaları İzleyici
Bu indikatör, kullanıcı tarafından belirlenen iki zaman periyodunda piyasanın ulaştığı en yüksek ve en düşük fiyatları tespit eder. Ardından, bu zirve ve dip noktalarını birleştiren iki çizgi çizer. Mor çizgi, en yüksek fiyatlar arasındaki bağlantıyı gösterirken; aqua çizgi, en düşük fiyatlar arasındaki ilişkiyi temsil eder. Her iki çizgi de geleceğe ve geçmişe doğru uzanarak, potansiyel destek ve direnç seviyeleri hakkında fikir verir.
Kullanımı:
İndikatörü grafik üzerine ekleyin.
İki zaman periyodu girin.
Zirve ve dip noktalarını birleştiren çizgilerin analizini yapın.
Bu araç, piyasanın önemli dönüm noktalarını görsel olarak anlamanıza ve yatırım stratejinizi bu bilgilere göre ayarlamanıza yardımcı olur.
This indicator identifies the highest and lowest prices reached in two user-defined time periods. It then draws two lines connecting these peak and trough points. The purple line represents the connection between the highest prices, while the aqua line represents the relationship between the lowest prices. Both lines extend into the future and past, providing insights into potential support and resistance levels.
How to Use:
- [1*]Add the indicator to your chart.
- [2*]Enter two time periods.
- [3*]Analyze the lines connecting peak and trough points.
This tool helps visually understand the market's key turning points and adjust your investment strategy based on these insights.
Zirve ve Dip Noktaları İzleyici
Bu indikatör, kullanıcı tarafından belirlenen iki zaman periyodunda piyasanın ulaştığı en yüksek ve en düşük fiyatları tespit eder. Ardından, bu zirve ve dip noktalarını birleştiren iki çizgi çizer. Mor çizgi, en yüksek fiyatlar arasındaki bağlantıyı gösterirken; aqua çizgi, en düşük fiyatlar arasındaki ilişkiyi temsil eder. Her iki çizgi de geleceğe ve geçmişe doğru uzanarak, potansiyel destek ve direnç seviyeleri hakkında fikir verir.
Kullanımı:
İndikatörü grafik üzerine ekleyin.
İki zaman periyodu girin.
Zirve ve dip noktalarını birleştiren çizgilerin analizini yapın.
Bu araç, piyasanın önemli dönüm noktalarını görsel olarak anlamanıza ve yatırım stratejinizi bu bilgilere göre ayarlamanıza yardımcı olur.
Notas de Lançamento
Language changesNotas de Lançamento
Language Changes v2Script de código aberto
Em verdadeiro espírito do TradingView, o criador deste script o tornou de código aberto, para que os traders possam revisar e verificar sua funcionalidade. Parabéns ao autor! Embora você possa usá-lo gratuitamente, lembre-se de que a republicação do código está sujeita às nossas Regras da Casa.
Aviso legal
As informações e publicações não se destinam a ser, e não constituem, conselhos ou recomendações financeiras, de investimento, comerciais ou de outro tipo fornecidos ou endossados pela TradingView. Leia mais nos Termos de Uso.
Script de código aberto
Em verdadeiro espírito do TradingView, o criador deste script o tornou de código aberto, para que os traders possam revisar e verificar sua funcionalidade. Parabéns ao autor! Embora você possa usá-lo gratuitamente, lembre-se de que a republicação do código está sujeita às nossas Regras da Casa.
Aviso legal
As informações e publicações não se destinam a ser, e não constituem, conselhos ou recomendações financeiras, de investimento, comerciais ou de outro tipo fornecidos ou endossados pela TradingView. Leia mais nos Termos de Uso.