OPEN-SOURCE SCRIPT
Atualizado Swing-Based Volatility Index

Swing-Based Volatility Index
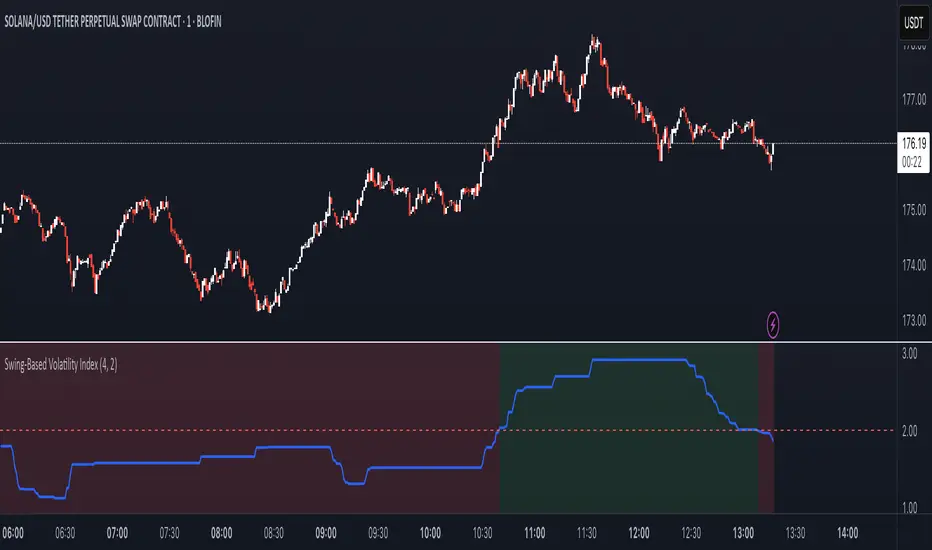
This indicator helps traders quickly determine whether the market has moved enough over the past few hours to justify scalping.
It measures the percentage price swing (high to low) over a configurable time window (e.g., last 4–8 hours) and compares it to a minimum threshold (e.g., 1%).
✅ If the percent move exceeds the threshold → Market is volatile enough to scalp (green background).
🚫 If it's below the threshold → Market is too quiet (red background).
Features:
Adjustable lookback period in hours
Custom threshold for volatility sensitivity
Automatically adapts to the current chart timeframe
This tool is ideal for scalpers and short-term traders who want to avoid entering trades in low-volatility environments.
Notas de Lançamento
📊 Swing-Based Volatility IndexThe Swing-Based Volatility Index is a tool for short-term traders and scalpers that evaluates whether the market has shown enough recent movement to justify initiating trades.
🧠 How It Works
This indicator measures the percentage swing between the highest and lowest prices over a user-defined lookback period (in hours). It dynamically calculates how many candles that represents based on the chart's current timeframe.
It then computes:
Swing % = (Highest High - Lowest Low) / Lowest Low × 100
This swing percentage is compared to a minimum volatility threshold (e.g., 1%). If the market has moved more than the threshold, it's considered sufficiently volatile for scalping.
✅ Signal Conditions
Green Background = Swing % exceeds your threshold → market is active, favorable for scalping.
Red Background = Swing % is below your threshold → market is calm, avoid trades.
⚙️ Features
Adjustable lookback period (in hours)
Configurable volatility threshold
Automatically adapts to any chart timeframe
Visual background coloring to guide decision-making
🎯 Use Case
This indicator is best used as a volatility filter before entering trades. It helps avoid choppy, range-bound environments where scalping strategies may perform poorly. Instead, it highlights conditions where price has moved significantly over recent hours — often indicating momentum or breakout potential.
Updated Indicator Name.
Script de código aberto
Em verdadeiro espírito do TradingView, o criador deste script o tornou de código aberto, para que os traders possam revisar e verificar sua funcionalidade. Parabéns ao autor! Embora você possa usá-lo gratuitamente, lembre-se de que a republicação do código está sujeita às nossas Regras da Casa.
Aviso legal
As informações e publicações não se destinam a ser, e não constituem, conselhos ou recomendações financeiras, de investimento, comerciais ou de outro tipo fornecidos ou endossados pela TradingView. Leia mais nos Termos de Uso.