OPEN-SOURCE SCRIPT
Atualizado Multiple SMAs
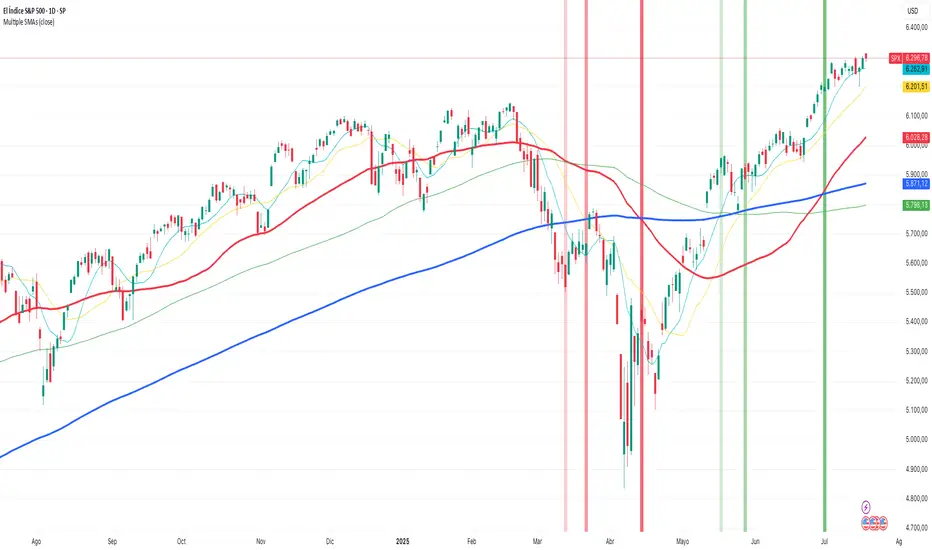
Plots multiple SMAs in a single indicator.
This script only plots the SMAs if the timeframe is set to daily.
- SMA10 in light blue
- SMA20 in yellow
- SMA50 in red
- SMA100 in green
- SMA200 in blue
It also plots the crosses between SMA20 and SMA50
This script only plots the SMAs if the timeframe is set to daily.
- SMA10 in light blue
- SMA20 in yellow
- SMA50 in red
- SMA100 in green
- SMA200 in blue
It also plots the crosses between SMA20 and SMA50
Notas de Lançamento
Plots multiple SMAs in a single indicator.This script only plots the SMAs if the timeframe is set to daily, weekly or monthly.
- SMA10 in light blue (daily or weekly)
- SMA20 in yellow (daily or weekly)
- SMA50 in red (daily or weekly)
- SMA100 in green
- SMA200 in blue
It also plots entry and exit alerts,
- Crosses between SMA10 and SMA200 (very light green/red vertical bar)
- Crosses between SMA20 and SMA200 (light green/red vertical bar)
- Crosses between SMA50 and SMA200 (green/red vertical bar)
Script de código aberto
Em verdadeiro espírito do TradingView, o criador deste script o tornou de código aberto, para que os traders possam revisar e verificar sua funcionalidade. Parabéns ao autor! Embora você possa usá-lo gratuitamente, lembre-se de que a republicação do código está sujeita às nossas Regras da Casa.
Aviso legal
As informações e publicações não se destinam a ser, e não constituem, conselhos ou recomendações financeiras, de investimento, comerciais ou de outro tipo fornecidos ou endossados pela TradingView. Leia mais nos Termos de Uso.