OPEN-SOURCE SCRIPT
Atualizado bean
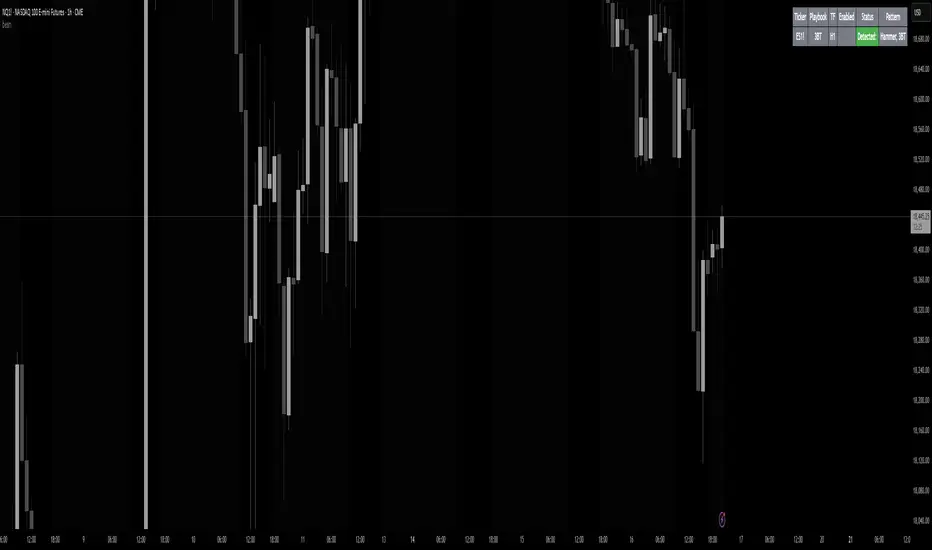
Bean's Multi-Instrument Pattern Scanner.
This indicator scans H1 timeframe for specific technical patterns. Here's how each pattern is detected:
PATTERN DETECTION CRITERIA:
1. Hammer
- Body Size: ≤ 30% of total candle length
- Lower Wick: > 50% of total candle length
- Upper Wick: < 20% of total candle length
- Formula:
* bodySize = |close - open|
* upperWick = high - max(open, close)
* lowerWick = min(open, close) - low
* totalLength = high - low
2. Shooting Star
- Body Size: ≤ 30% of total candle length
- Upper Wick: > 50% of total candle length
- Lower Wick: < 20% of total candle length
- Uses same measurements as Hammer but inverted
3. Outside/Inside (OI)
Checks three consecutive bars:
- Outside Bar: Bar2 high ≥ Bar3 high AND Bar2 low ≤ Bar3 low
- Inside Bar: Bar1 high ≤ Bar2 high AND Bar1 low ≥ Bar2 low
Pattern confirms when both conditions are met
4. Bullish/Bearish Umbrella
Checks two consecutive bars:
Bullish:
- Current bar's high ≤ previous bar's high
- Current body high ≤ previous bar's high
- Current body low ≥ previous body high
Bearish:
- Current bar's low ≥ previous bar's low
- Current body low ≥ previous bar's low
- Current body high ≤ previous body low
5. Three Bar Triangle (3BT)
Checks three consecutive bars:
- Current bar's high ≤ max(previous two highs)
- Current bar's low ≥ min(previous two lows)
- Indicates price compression
DISPLAY AND ALERTS:
- Patterns are displayed in real-time in the table
- Multiple patterns can be detected simultaneously
- Pattern detection resets each new H1 candle
CONFIGURATION:
- Each row can be independently configured
- Patterns are checked on H1 timeframe close
- Alert frequency: Once per H1 bar close
Note: All measurements use standard OHLC values from only completed H1 candles.
Notas de Lançamento
Bean's Multi-Instrument Pattern Scanner.This indicator scans H1 timeframe for specific technical patterns. Here's how each pattern is detected:
PATTERN DETECTION CRITERIA:
1. Hammer
- Body Size: ≤ 30% of total candle length
- Lower Wick: > 50% of total candle length
- Upper Wick: < 20% of total candle length
- Formula:
* bodySize = |close - open|
* upperWick = high - max(open, close)
* lowerWick = min(open, close) - low
* totalLength = high - low
2. Shooting Star
- Body Size: ≤ 30% of total candle length
- Upper Wick: > 50% of total candle length
- Lower Wick: < 20% of total candle length
- Uses same measurements as Hammer but inverted
3. Outside/Inside (OI)
Checks three consecutive bars:
- Outside Bar: Bar2 high ≥ Bar3 high AND Bar2 low ≤ Bar3 low
- Inside Bar: Bar1 high ≤ Bar2 high AND Bar1 low ≥ Bar2 low
Pattern confirms when both conditions are met
4. Bullish/Bearish Umbrella
Checks two consecutive bars:
Bullish:
- Current bar's high ≤ previous bar's high
- Current body high ≤ previous bar's high
- Current body low ≥ previous body high
Bearish:
- Current bar's low ≥ previous bar's low
- Current body low ≥ previous bar's low
- Current body high ≤ previous body low
5. Three Bar Triangle (3BT)
Checks three consecutive bars:
- Current bar's high ≤ max(previous two highs)
- Current bar's low ≥ min(previous two lows)
- Indicates price compression
DISPLAY AND ALERTS:
- Patterns are displayed in real-time in the table
- Multiple patterns can be detected simultaneously
- Pattern detection resets each new H1 candle
CONFIGURATION:
- Each row can be independently configured
- Patterns are checked on H1 timeframe close
- Alert frequency: Once per H1 bar close
Note: All measurements use standard OHLC values from only completed H1 candles.
Notas de Lançamento
More tickersNotas de Lançamento
btcusd and ethusd tickersNotas de Lançamento
Patched alerts capability.Notas de Lançamento
Patched alerts.Notas de Lançamento
- Forex feed is FXCM hard-coded now- Added timeframe selection
Notas de Lançamento
- Reduced no. of playbooks in selection.Notas de Lançamento
Now you can add any umbrella as an alertNotas de Lançamento
Now changing the umbrella formula slightly:prev_high <= prev2_high and prev_body_high <= prev2_high and prev_body_low >= ((prev2_body_high + prev2_body_low)/2)
Script de código aberto
Em verdadeiro espírito do TradingView, o criador deste script o tornou de código aberto, para que os traders possam revisar e verificar sua funcionalidade. Parabéns ao autor! Embora você possa usá-lo gratuitamente, lembre-se de que a republicação do código está sujeita às nossas Regras da Casa.
Aviso legal
As informações e publicações não se destinam a ser, e não constituem, conselhos ou recomendações financeiras, de investimento, comerciais ou de outro tipo fornecidos ou endossados pela TradingView. Leia mais nos Termos de Uso.