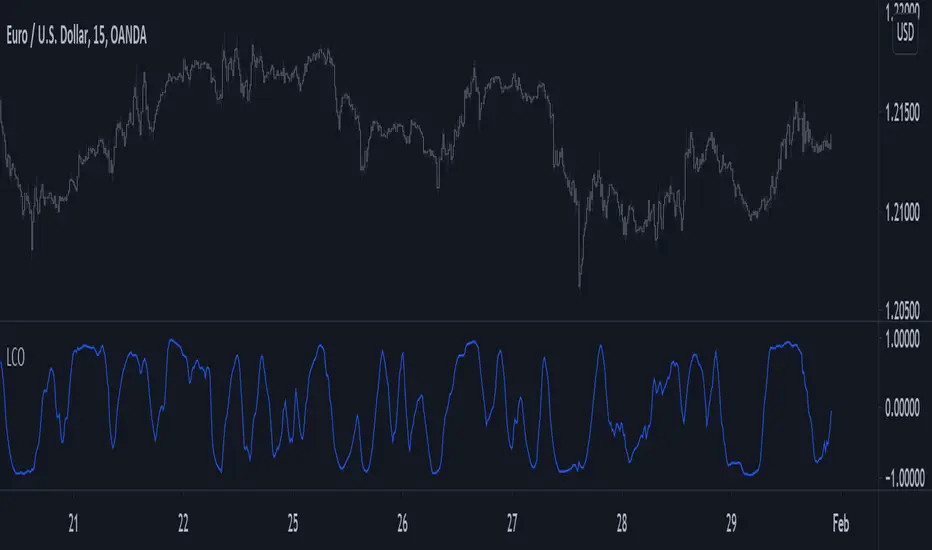
You don't need loops to get the rolling correlation between an input series and a linear sequence of values, this can be obtained from the normalized difference between a WMA and an SMA of the input series.
The closed-form solutions for the moving average and standard deviation of a linear sequence can be easily calculated, while the same rolling statistics for the input series can be computed using cumulative sums. All these concepts were introduced in previous indicators posts long ago.
This approach can allow to efficiently compute the rolling R-Squared of a linear regression, as well as its SSE.
Using the rolling correlation as a trend indicator is often attributed to John Ehlers with the correlation trend indicator (Correlation As A Trend Indicator), but the applications of this precise method can be traced back quite a while ago by a wide variety of users, in fact, the LSMA can be computed using this precise indicator. You can see an example where the correlation oscillator appears below:

Script de código aberto
Em verdadeiro espírito do TradingView, o criador deste script o tornou de código aberto, para que os traders possam revisar e verificar sua funcionalidade. Parabéns ao autor! Embora você possa usá-lo gratuitamente, lembre-se de que a republicação do código está sujeita às nossas Regras da Casa.
Check out the indicators we are making at luxalgo: tradingview.com/u/LuxAlgo/
"My heart is so loud that I can't hear the fireworks"
"My heart is so loud that I can't hear the fireworks"
Aviso legal
As informações e publicações não se destinam a ser, e não constituem, conselhos ou recomendações financeiras, de investimento, comerciais ou de outro tipo fornecidos ou endossados pela TradingView. Leia mais nos Termos de Uso.
