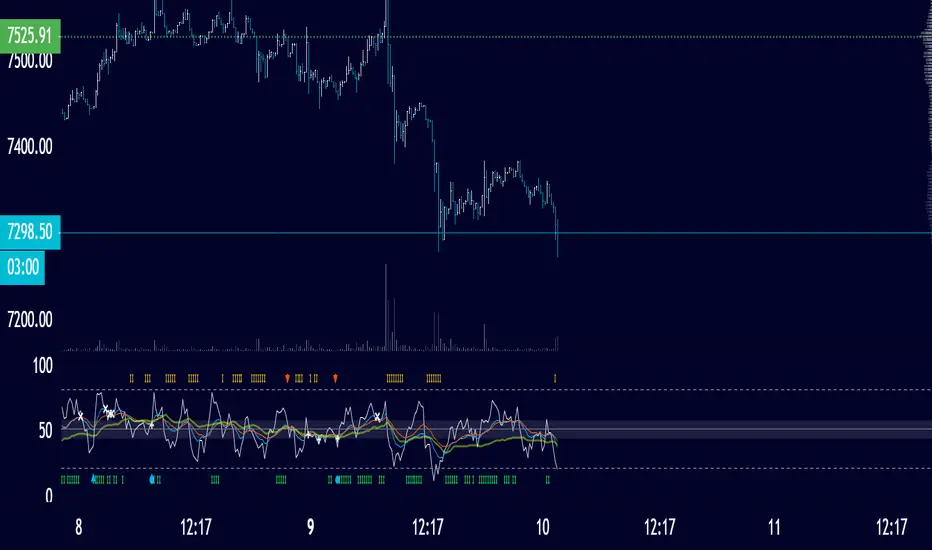
SRSI Multi TF

Meaning you can now trade the HTF RSI momentum while on the LTF
so for instance I trade the 5m chart but using the m30 trend using this indicator
the multiple between the two values is 5 so id suggest you keep your multiple the same. So if you want to trade the H1 chart you would set the TREND or "HTF Fast Line" to 300.
Time frames are in integers and run all the way up the "D"
ex
5 min = 5
30 min = 30
60 min = 60
H4 = 240
etc.
you also have
D2, D3
W
M
etc.
best used with EW in mind or some other pattern analysis as this would act as CONFLUENCE to an idea you already entered OR as CONFIRMATION to an idea OR some form of MA such as TrendAID
There are signals in regards to momentum , short/long, and a signal i created that uses a series of other criteria to fire.
The strategy is easy for this is as folllowed
SRSI > Fast Line (cyan) and Fast Line > HTF Fast Line(gold) and Med Line(red) > HTF Fast Line == LONG or longs of interest NOTE WHEN THE TREND IS STRONG YOUR HTF slow line will RANGE above or below 50.
VICE versa
You will notice the cyan FAST LINE will LEAD , confirmation of trend reversal is when SRSI breaks above and the above follows.
CHEERS.
removed a few unneeded settings :)
-- next update is take profit signals :) --
Script sob convite
Somente usuários aprovados pelo autor podem acessar este script. Você precisará solicitar e obter permissão para usá-lo. Normalmente, essa permissão é concedida após o pagamento. Para obter mais detalhes, siga as instruções do autor abaixo ou entre em contato diretamente com SatoshiHeavy.
A TradingView NÃO recomenda pagar ou usar um script, a menos que você confie totalmente em seu autor e entenda como ele funciona. Você também pode encontrar alternativas gratuitas e de código aberto em nossos scripts da comunidade.
Instruções do autor
Aviso legal
Script sob convite
Somente usuários aprovados pelo autor podem acessar este script. Você precisará solicitar e obter permissão para usá-lo. Normalmente, essa permissão é concedida após o pagamento. Para obter mais detalhes, siga as instruções do autor abaixo ou entre em contato diretamente com SatoshiHeavy.
A TradingView NÃO recomenda pagar ou usar um script, a menos que você confie totalmente em seu autor e entenda como ele funciona. Você também pode encontrar alternativas gratuitas e de código aberto em nossos scripts da comunidade.