OPEN-SOURCE SCRIPT
Volume Percentage
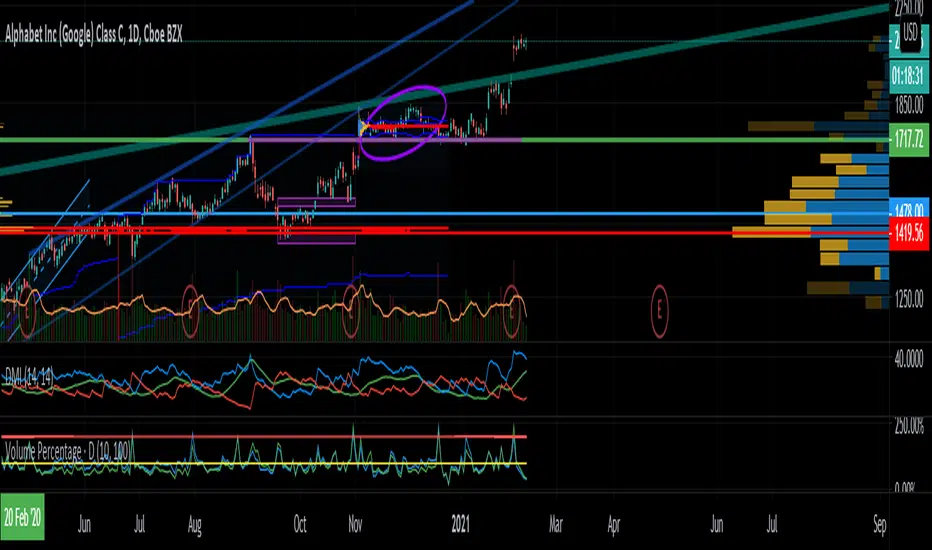
Volume percentage oscillator that compares the current volume value with the average of each two periods of volume, one fast (10 days) and one slow (100 days).
There are two horizontal lines that are a good visual guide, one in 100% and the other in 200%, which are very useful.
Special thanks to rick_decard.
There are two horizontal lines that are a good visual guide, one in 100% and the other in 200%, which are very useful.
Special thanks to rick_decard.
Script de código aberto
Em verdadeiro espírito do TradingView, o criador deste script o tornou de código aberto, para que os traders possam revisar e verificar sua funcionalidade. Parabéns ao autor! Embora você possa usá-lo gratuitamente, lembre-se de que a republicação do código está sujeita às nossas Regras da Casa.
Aviso legal
As informações e publicações não se destinam a ser, e não constituem, conselhos ou recomendações financeiras, de investimento, comerciais ou de outro tipo fornecidos ou endossados pela TradingView. Leia mais nos Termos de Uso.