OPEN-SOURCE SCRIPT
Atualizado RSI Trigger Count (30 Days) - Both Sides
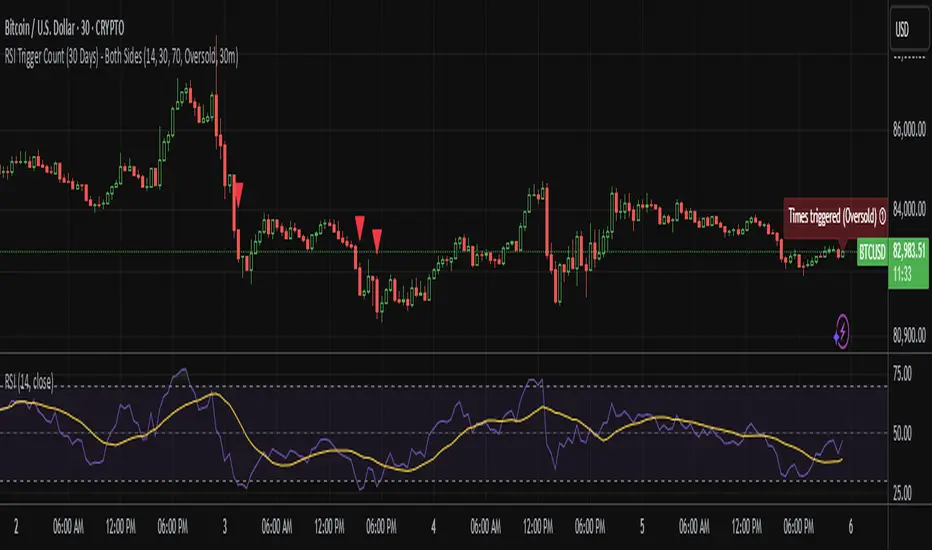
RSI Dual Trigger Counter (30 Days)
This indicator tracks both oversold (crossunder) and overbought (crossover) RSI events on a 30-minute chart, featuring:
Dual-Mode Selector:
Counts either RSI < 30 (oversold) or RSI > 70 (overbought) crossings
Toggle between modes via input menu
30-Day Rolling Count:
Displays total triggers in the last 30 days (e.g., "Times triggered (Oversold) ① 19")
Visual Alerts:
Red triangles ↓ for oversold crossunders
Green triangles ↑ for overbought crossovers
Customizable:
Adjustable RSI length (2-100) and thresholds (1-100)
Works on any timeframe (auto-scales calculations)
Purpose: Identifies frequent reversal signals for both buying dips (oversold) and selling rallies (overbought).
Notas de Lançamento
Features:Tracks both oversold (RSI < 30) and overbought (RSI > 70) signals with a toggle.
30-day rolling count resets automatically.
Visual alerts (▼ red for oversold, ▲ green for overbought).
Works on all timeframes (1m to 1D+).
Use Cases:
Spot mean-reversion opportunities.
Confirm overextended price movements.
Inputs:
Adjustable RSI length, thresholds, and condition type (oversold/overbought).
Script de código aberto
Em verdadeiro espírito do TradingView, o criador deste script o tornou de código aberto, para que os traders possam revisar e verificar sua funcionalidade. Parabéns ao autor! Embora você possa usá-lo gratuitamente, lembre-se de que a republicação do código está sujeita às nossas Regras da Casa.
Aviso legal
As informações e publicações não se destinam a ser, e não constituem, conselhos ou recomendações financeiras, de investimento, comerciais ou de outro tipo fornecidos ou endossados pela TradingView. Leia mais nos Termos de Uso.