OPEN-SOURCE SCRIPT
Atualizado RHODL_Ratio
Indicator Overview
This indicator uses a ratio of Realized Value HODL Waves.
In summary, Realized Value HODL waves are different age bands of UTXO’s (coins) weighted by the Realized Value of coins within each band.
The Realized Value is the price of UTXO’s (coins) when they were last moved from one wallet to another.
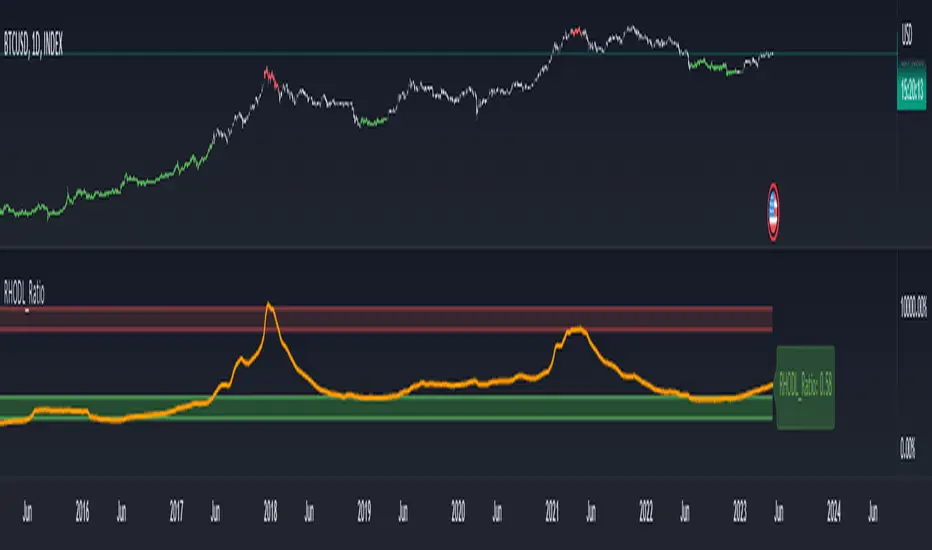
RHODL Ratio looks at the ratio between RHODL band of 1 week versus the RHODL band of 1-2yrs.
It also calibrates for increased hodl’ing over time and for lost coins by multiplying the ratio by the age of the market in number of days.
When the 1-week value is significantly higher than the 1-2yr it is a signal that the market is becoming overheated.
How to Use this Indicator
When RHODL ratio starts to approach the red band it can signal that the market is overheating (Red bars on a chart). This has historically been a good time for investors to take profits in each cycle.
When RHODL ratio starts to approach the green band it can signal great time to buy (Green bars on a chart)
If you change an upper band location this automatically affects on the normalization of value what you can send with allert and what you see on the lable.
This version have differences to original one
Original idea of:
Philip Swift (positivecrypto)
This indicator uses a ratio of Realized Value HODL Waves.
In summary, Realized Value HODL waves are different age bands of UTXO’s (coins) weighted by the Realized Value of coins within each band.
The Realized Value is the price of UTXO’s (coins) when they were last moved from one wallet to another.
RHODL Ratio looks at the ratio between RHODL band of 1 week versus the RHODL band of 1-2yrs.
It also calibrates for increased hodl’ing over time and for lost coins by multiplying the ratio by the age of the market in number of days.
When the 1-week value is significantly higher than the 1-2yr it is a signal that the market is becoming overheated.
How to Use this Indicator
When RHODL ratio starts to approach the red band it can signal that the market is overheating (Red bars on a chart). This has historically been a good time for investors to take profits in each cycle.
When RHODL ratio starts to approach the green band it can signal great time to buy (Green bars on a chart)
If you change an upper band location this automatically affects on the normalization of value what you can send with allert and what you see on the lable.
This version have differences to original one
Original idea of:
Philip Swift (positivecrypto)
Notas de Lançamento
-Script de código aberto
Em verdadeiro espírito do TradingView, o criador deste script o tornou de código aberto, para que os traders possam revisar e verificar sua funcionalidade. Parabéns ao autor! Embora você possa usá-lo gratuitamente, lembre-se de que a republicação do código está sujeita às nossas Regras da Casa.
Aviso legal
As informações e publicações não se destinam a ser, e não constituem, conselhos ou recomendações financeiras, de investimento, comerciais ou de outro tipo fornecidos ou endossados pela TradingView. Leia mais nos Termos de Uso.
Script de código aberto
Em verdadeiro espírito do TradingView, o criador deste script o tornou de código aberto, para que os traders possam revisar e verificar sua funcionalidade. Parabéns ao autor! Embora você possa usá-lo gratuitamente, lembre-se de que a republicação do código está sujeita às nossas Regras da Casa.
Aviso legal
As informações e publicações não se destinam a ser, e não constituem, conselhos ou recomendações financeiras, de investimento, comerciais ou de outro tipo fornecidos ou endossados pela TradingView. Leia mais nos Termos de Uso.