OPEN-SOURCE SCRIPT
%Bs
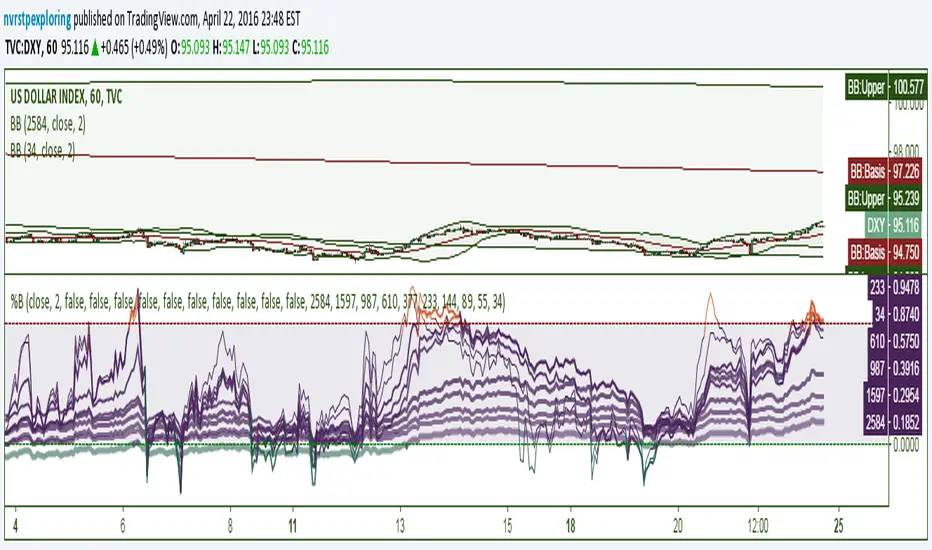
An indicator with 10 configurable %B lines for identifying trends, overbought and oversold conditions, and reversal points. %B is a linear representation of a securities relationship to the Upper and Lower Bollinger Bands. The best opportunities arise when a security is oversold in a bullish trend and overbought in a bearish trend. The longer %B trend-lines in this indicator are very useful for major reversals. They can be used to indicate the high or low of the day on a 1-minute chart or show a multi-year reversal point.
%B = (Current Price - Lower Band) / (Upper Band - Lower Band)
%B = (Current Price - Lower Band) / (Upper Band - Lower Band)
Script de código aberto
Em verdadeiro espírito do TradingView, o criador deste script o tornou de código aberto, para que os traders possam revisar e verificar sua funcionalidade. Parabéns ao autor! Embora você possa usá-lo gratuitamente, lembre-se de que a republicação do código está sujeita às nossas Regras da Casa.
Aviso legal
As informações e publicações não se destinam a ser, e não constituem, conselhos ou recomendações financeiras, de investimento, comerciais ou de outro tipo fornecidos ou endossados pela TradingView. Leia mais nos Termos de Uso.