OPEN-SOURCE SCRIPT
Inertia Indicator
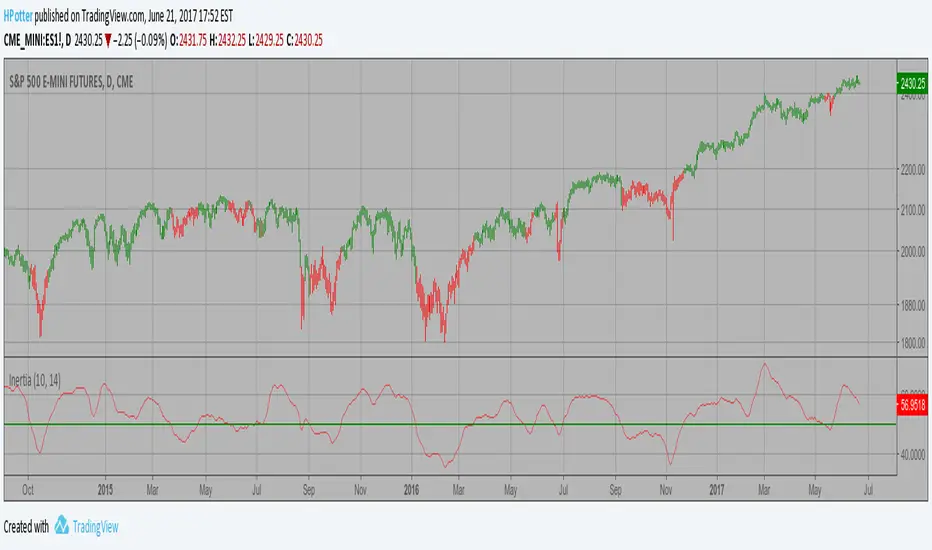
The inertia indicator measures the market, stock or currency pair momentum and
trend by measuring the security smoothed RVI (Relative Volatility Index).
The RVI is a technical indicator that estimates the general direction of the
volatility of an asset.
The inertia indicator returns a value that is comprised between 0 and 100.
Positive inertia occurs when the indicator value is higher than 50. As long as
the inertia value is above 50, the long-term trend of the security is up. The inertia
is negative when its value is lower than 50, in this case the long-term trend is
down and should stay down if the inertia stays below 50.
Script de código aberto
Em verdadeiro espírito do TradingView, o criador deste script o tornou de código aberto, para que os traders possam revisar e verificar sua funcionalidade. Parabéns ao autor! Embora você possa usá-lo gratuitamente, lembre-se de que a republicação do código está sujeita às nossas Regras da Casa.
Aviso legal
As informações e publicações não se destinam a ser, e não constituem, conselhos ou recomendações financeiras, de investimento, comerciais ou de outro tipo fornecidos ou endossados pela TradingView. Leia mais nos Termos de Uso.