PROTECTED SOURCE SCRIPT
Tweezer Pattern
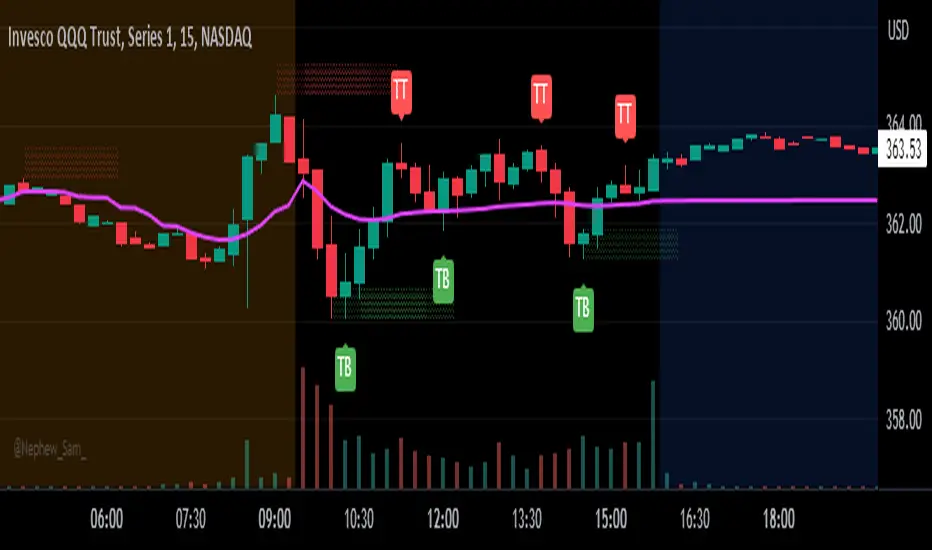
This is a rudimentary indicator to plot tweezer bottoms and tweezer tops. I use this primarily on the 15 minute, but may be applicable to other timeframes.
Criteria for a Tweezer Bottom:
- We were previously in a downtrend (determined by the color of the previous two candles)
- The current candle is green
- The current and previous candle have lower wicks
- The current candle open is approximately the same as the previous candle close (adjustable through settings)
Criteria for a Tweezer Top:
- We were previously in an uptrend (determined by the color of the previous two candles)
- The current candle is red
- The current and previous candle have upper wicks
- The current candle open is approximately the same as the previous candle close (adjustable through settings)
Potential Improvements:
- Determine trend through TA, for example using SMAs
- Ensure wick length as some percentage of candle height instead of just checking for existence
- Ensure tweezer candle is large or has some required minimum volume to reduce false positives
For any improvements or ideas, feel free to contact me :)
Script protegido
Esse script é publicada como código fechado. No entanto, você pode gerenciar suas escolhas de bate-papo. Por favor, abra suas Configurações do perfil
Aviso legal
As informações e publicações não se destinam a ser, e não constituem, conselhos ou recomendações financeiras, de investimento, comerciais ou de outro tipo fornecidos ou endossados pela TradingView. Leia mais nos Termos de Uso.