OPEN-SOURCE SCRIPT
Atualizado Support and Resistance Lines
Draw the last 5 support and resistance lines. It works on the current timeframe. You can adjust the sensibility by changing the diff variable.
Notas de Lançamento
Draw the last 5 support and resistance lines on current timeframe.Notas de Lançamento
Exposed some parameters:- Maximum Bars to Analyze
- Sensitivity in Pips for Resistance/Support
Notas de Lançamento
Some improvements for JPY chartsNotas de Lançamento
This script dynamically identifies and plots support and resistance levels on the chart using recent highs and lows. The indicator is fully customizable, allowing traders to adjust sensitivity and the number of bars analyzed, making it suitable for different timeframes and trading strategies.What It Does
The indicator calculates up to five resistance levels and five support levels based on recent price action:
- Resistance Lines: Represent areas where price has faced upward rejection.
- Support Lines: Represent areas where price has shown buying interest and bounced upward.
The script:
- Scans historical bars to detect significant highs (resistance) and lows (support).
- Filters new levels based on a configurable sensitivity parameter in pips to ensure meaningful zones.
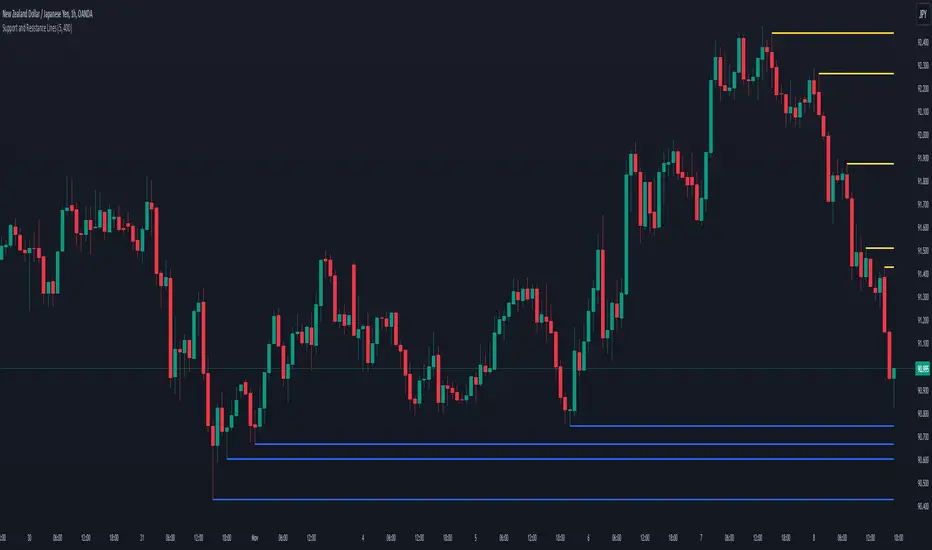
- Plots the lines dynamically:
- Yellow lines for resistances.
- Blue lines for supports.
How It Works
- A parameter (Sensitivity in Pips) allows users to define the minimum distance required for a new support or resistance level to be identified. For example, a higher sensitivity (e.g., 10 pips) will filter out small fluctuations, focusing on stronger levels.
- The script iterates through a user-defined number of historical bars (Maximum Bars to Analyze) to identify key highs and lows.
- It maintains the most recent five resistance and five support levels, updating dynamically as new highs and lows are detected.
- Resistance and support lines are drawn horizontally across the chart and update automatically with the most relevant levels.
Script de código aberto
Em verdadeiro espírito do TradingView, o criador deste script o tornou de código aberto, para que os traders possam revisar e verificar sua funcionalidade. Parabéns ao autor! Embora você possa usá-lo gratuitamente, lembre-se de que a republicação do código está sujeita às nossas Regras da Casa.
Aviso legal
As informações e publicações não se destinam a ser, e não constituem, conselhos ou recomendações financeiras, de investimento, comerciais ou de outro tipo fornecidos ou endossados pela TradingView. Leia mais nos Termos de Uso.