PROTECTED SOURCE SCRIPT
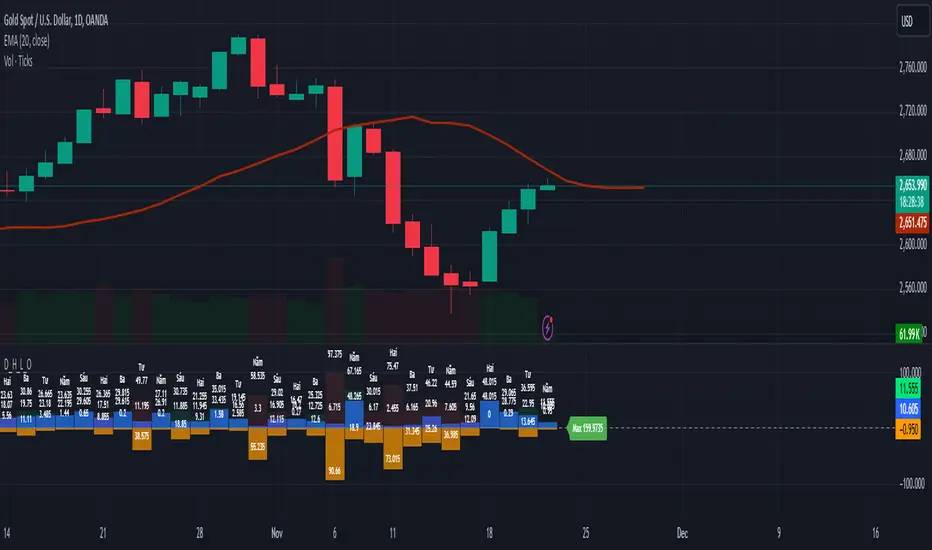
D_H_L_O

Indicator Name: D_H_L_O
Primary Function:
This indicator is designed to display buying pressure, selling pressure, and other key metrics derived from the daily candle on a TradingView chart. It helps you analyze market momentum, buying and selling forces, and price spreads.
Features Overview:
Basic Calculations from Daily Candle:
dailyHigh, dailyLow, dailyOpen, dailyClose: Represent the high, low, open, and close prices of the daily candle.
dailySpread: The difference between the high and low prices of the daily candle.
Buying and Selling Pressure:
Buying Pressure (high_open): The difference between the daily high and the open price.
Selling Pressure (low_open): The absolute difference between the daily low and the open price (displayed as a negative value).
deltaVolume: The net difference between buying and selling pressure.
Color and Visuals:
Blue (buyingColor): Indicates buying pressure for green (bullish) days.
Orange (sellingColor): Indicates selling pressure for red (bearish) days.
Displays bars with transparency to distinguish buying and selling forces.
Neutral Reference Line:
A horizontal line at 0 for quick visual comparison of buying and selling forces.
Labels for Key Information:
Displays values of buying pressure, selling pressure, and daily candle spread directly on the chart at corresponding bar positions.
Includes the weekday name (currentWeekday) for additional time context.
Historical Statistics:
Highest and lowest values of buying and selling pressure across the dataset.
Average buying and selling pressure.
Displays statistical summaries (like maximum pressure values) as labels on the last bar of the chart.
Benefits:
Detailed Market Pressure Visualization: Provides a clear view of the forces driving market movement each day.
Historical Context: Helps analyze historical trends in buying and selling pressures over time.
Decision-Making Support: Use pressure metrics to gauge market momentum and assess potential trends.
How to Use:
Copy and paste the script into TradingView (create a new indicator using Pine Script v5).
Add the indicator to your chart on any timeframe to observe daily candle metrics.
Customize colors, transparency, or other parameters to suit your trading style.
This indicator is ideal for traders who want to analyze price momentum and make decisions based on daily market behavior.
Script protegido
Esse script é publicada como código fechado. No entanto, você pode gerenciar suas escolhas de bate-papo. Por favor, abra suas Configurações do perfil
Aviso legal
As informações e publicações não se destinam a ser, e não constituem, conselhos ou recomendações financeiras, de investimento, comerciais ou de outro tipo fornecidos ou endossados pela TradingView. Leia mais nos Termos de Uso.