OPEN-SOURCE SCRIPT
Atualizado OrderBlock Trend (CISD)
OrderBlock Trend (CISD) Indicator
Overview:
The "OrderBlock Trend (CISD)" AKA: change in state of delivery by ICT inner circle trader this indicator is designed to help traders identify and visualize market trends based on higher timeframe candle behavior. This script leverages the concept of order blocks, which are price levels where significant buying or selling activity has occurred, to signal potential trend reversals or continuations. By analyzing bullish and bearish order blocks on a higher timeframe, the indicator provides visual cues and statistical insights into the market's current trend dynamics.
Key Features:
Higher Timeframe Analysis: The indicator uses a higher timeframe (e.g., Daily) to assess the trend direction based on the open and close prices of candles. This approach helps in identifying more significant and reliable trend changes, filtering out noise from lower timeframes.
Bullish and Bearish Order Blocks: The script detects the first bullish or bearish candle on the selected higher timeframe and uses these candles as reference points (order blocks) to determine the trend direction. A bullish trend is indicated when the current price is above the last bearish order block's open price, and a bearish trend is indicated when the price is below the last bullish order block's open price.
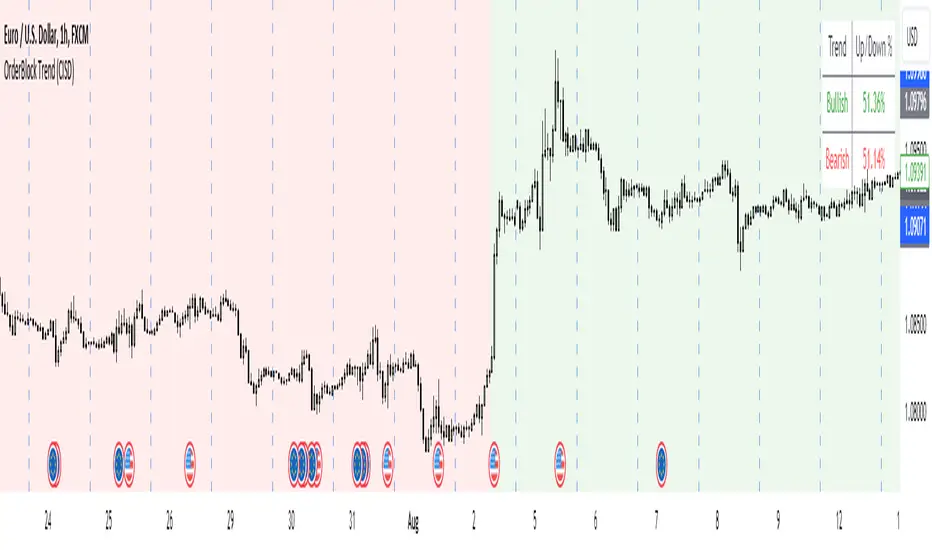
Visual Trend Indication: The indicator visually represents the trend using background colors and plot shapes:
A green background and a square shape above the bars indicate a bullish trend.
A red background and a square shape above the bars indicate a bearish trend.
Candle Count and Statistics: The script keeps track of the number of up and down candles during bullish and bearish trends, providing percentages of up and down candles in each trend. This data is displayed in a table, giving traders a quick overview of market sentiment during each trend phase.
User Customization: The higher timeframe can be adjusted according to the trader's preference, allowing flexibility in trend analysis based on different time horizons.
Concepts and Calculations:
The "OrderBlock Trend (CISD)" indicator is based on the concept of order blocks, a key area where institutional traders are believed to place large orders, creating significant support or resistance levels. By identifying these blocks on a higher timeframe, the indicator aims to highlight potential trend reversals or continuations. The use of higher timeframe data helps filter out minor fluctuations and focus on more meaningful price movements.
The candle count and percentage calculations provide additional context, allowing traders to understand the proportion of bullish or bearish candles within each trend. This information can be useful for assessing the strength and consistency of a trend.
How to Use:
Select the Higher Timeframe: Choose the higher timeframe (e.g., Daily) that best suits your trading strategy. The default setting is "D" (Daily), but it can be adjusted to other timeframes as needed.
Interpret the Trend Signals:
A green background indicates a bullish trend, while a red background indicates a bearish trend. The corresponding square shapes above the bars reinforce these signals.
Use the information on the proportion of up and down candles during each trend to gauge the trend's strength and consistency.
Trading Decisions: The indicator can be used in conjunction with other technical analysis tools and indicators to make informed trading decisions. It is particularly useful for identifying trend reversals and potential entry or exit points based on the behavior of higher timeframe order blocks.
Customization and Optimization: Experiment with different higher timeframes and settings to optimize the indicator for your specific trading style and preferences.
Conclusion:
The "OrderBlock Trend (CISD)" indicator offers a comprehensive approach to trend analysis, combining the power of higher timeframe order blocks with clear visual cues and statistical insights. By understanding the underlying concepts and utilizing the provided features, traders can enhance their trend detection and decision-making processes in the markets.
Disclaimer:
This indicator is intended for educational purposes and should be used in conjunction with other analysis methods. Always perform your own research and risk management before making trading decisions.
Some known bugs when you switch to lower timeframe while using daily timeframe data it didn't use the daily candle close to establish the trend change but your current time frame If some of you know how to fix it that would be great if you help me to I would try my best to fix this in the future :) credit to ChatGPT 4o
Overview:
The "OrderBlock Trend (CISD)" AKA: change in state of delivery by ICT inner circle trader this indicator is designed to help traders identify and visualize market trends based on higher timeframe candle behavior. This script leverages the concept of order blocks, which are price levels where significant buying or selling activity has occurred, to signal potential trend reversals or continuations. By analyzing bullish and bearish order blocks on a higher timeframe, the indicator provides visual cues and statistical insights into the market's current trend dynamics.
Key Features:
Higher Timeframe Analysis: The indicator uses a higher timeframe (e.g., Daily) to assess the trend direction based on the open and close prices of candles. This approach helps in identifying more significant and reliable trend changes, filtering out noise from lower timeframes.
Bullish and Bearish Order Blocks: The script detects the first bullish or bearish candle on the selected higher timeframe and uses these candles as reference points (order blocks) to determine the trend direction. A bullish trend is indicated when the current price is above the last bearish order block's open price, and a bearish trend is indicated when the price is below the last bullish order block's open price.
Visual Trend Indication: The indicator visually represents the trend using background colors and plot shapes:
A green background and a square shape above the bars indicate a bullish trend.
A red background and a square shape above the bars indicate a bearish trend.
Candle Count and Statistics: The script keeps track of the number of up and down candles during bullish and bearish trends, providing percentages of up and down candles in each trend. This data is displayed in a table, giving traders a quick overview of market sentiment during each trend phase.
User Customization: The higher timeframe can be adjusted according to the trader's preference, allowing flexibility in trend analysis based on different time horizons.
Concepts and Calculations:
The "OrderBlock Trend (CISD)" indicator is based on the concept of order blocks, a key area where institutional traders are believed to place large orders, creating significant support or resistance levels. By identifying these blocks on a higher timeframe, the indicator aims to highlight potential trend reversals or continuations. The use of higher timeframe data helps filter out minor fluctuations and focus on more meaningful price movements.
The candle count and percentage calculations provide additional context, allowing traders to understand the proportion of bullish or bearish candles within each trend. This information can be useful for assessing the strength and consistency of a trend.
How to Use:
Select the Higher Timeframe: Choose the higher timeframe (e.g., Daily) that best suits your trading strategy. The default setting is "D" (Daily), but it can be adjusted to other timeframes as needed.
Interpret the Trend Signals:
A green background indicates a bullish trend, while a red background indicates a bearish trend. The corresponding square shapes above the bars reinforce these signals.
Use the information on the proportion of up and down candles during each trend to gauge the trend's strength and consistency.
Trading Decisions: The indicator can be used in conjunction with other technical analysis tools and indicators to make informed trading decisions. It is particularly useful for identifying trend reversals and potential entry or exit points based on the behavior of higher timeframe order blocks.
Customization and Optimization: Experiment with different higher timeframes and settings to optimize the indicator for your specific trading style and preferences.
Conclusion:
The "OrderBlock Trend (CISD)" indicator offers a comprehensive approach to trend analysis, combining the power of higher timeframe order blocks with clear visual cues and statistical insights. By understanding the underlying concepts and utilizing the provided features, traders can enhance their trend detection and decision-making processes in the markets.
Disclaimer:
This indicator is intended for educational purposes and should be used in conjunction with other analysis methods. Always perform your own research and risk management before making trading decisions.
Some known bugs when you switch to lower timeframe while using daily timeframe data it didn't use the daily candle close to establish the trend change but your current time frame If some of you know how to fix it that would be great if you help me to I would try my best to fix this in the future :) credit to ChatGPT 4o
Notas de Lançamento
Add Alert FunctionNotas de Lançamento
-- option to select whether the trend change is based on the first candle's close or high/lowNotas de Lançamento
Trend changes at the close of the daily candle or any higher timeframe you preferNotas de Lançamento
Back to previous versionScript de código aberto
Em verdadeiro espírito do TradingView, o criador deste script o tornou de código aberto, para que os traders possam revisar e verificar sua funcionalidade. Parabéns ao autor! Embora você possa usá-lo gratuitamente, lembre-se de que a republicação do código está sujeita às nossas Regras da Casa.
Aviso legal
As informações e publicações não se destinam a ser, e não constituem, conselhos ou recomendações financeiras, de investimento, comerciais ou de outro tipo fornecidos ou endossados pela TradingView. Leia mais nos Termos de Uso.
Script de código aberto
Em verdadeiro espírito do TradingView, o criador deste script o tornou de código aberto, para que os traders possam revisar e verificar sua funcionalidade. Parabéns ao autor! Embora você possa usá-lo gratuitamente, lembre-se de que a republicação do código está sujeita às nossas Regras da Casa.
Aviso legal
As informações e publicações não se destinam a ser, e não constituem, conselhos ou recomendações financeiras, de investimento, comerciais ou de outro tipo fornecidos ou endossados pela TradingView. Leia mais nos Termos de Uso.