OPEN-SOURCE SCRIPT
Atualizado EMA 50 & 200 (TF-specific)
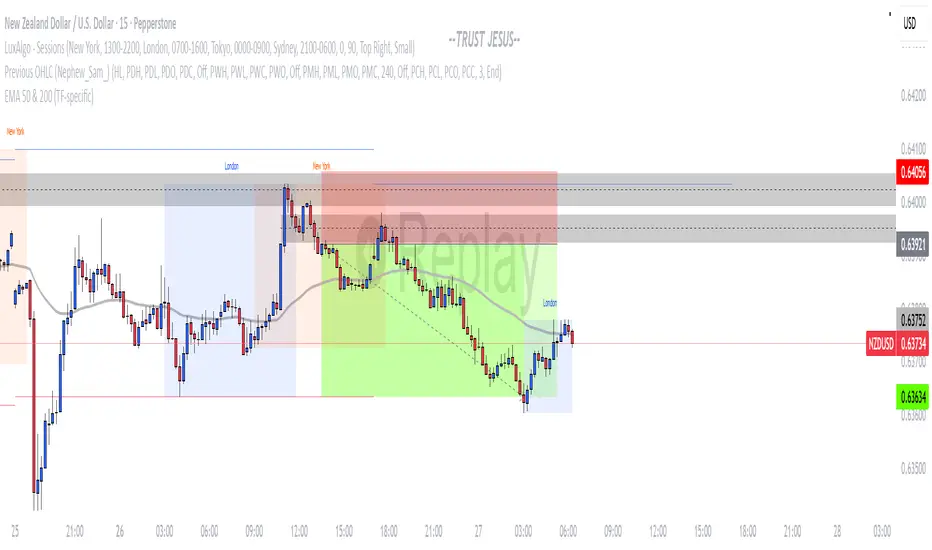
This script plots EMA 50 and EMA 200 only on the timeframes where they matter most:
EMA 50 (gray): visible on 1H, 4H, and 12H charts – often used by intraday traders.
EMA 200 (black): visible on Daily and Weekly charts – a classic long-term trend indicator.
🔹 Why use it?
Avoids clutter by showing each EMA only on the relevant timeframe.
Helps align intraday trading with higher timeframe trends.
Simple, clean, and effective for both swing and day trading.
Notas de Lançamento
This script plots EMA 50 and EMA 200 only on the timeframes where they matter most:EMA 50 (gray): visible on 5m, 15m, 30m, 1H, 4H, and 12H charts – often used by intraday traders.
EMA 200 (black): visible on Daily and Weekly charts – a classic long-term trend indicator.
🔹 Why use it?
Avoids clutter by showing each EMA only on the relevant timeframe.
Helps align intraday trading with higher timeframe trends.
Simple, clean, and effective for both swing and day trading.
Script de código aberto
No verdadeiro espirito do TradingView, o autor desse script o publicou como código aberto, para que os traders possam entendê-lo e verificá-lo. Parabéns ao autor Você pode usá-lo gratuitamente, mas a reutilização desse código em publicações e regida pelas Regras da Casa.
Aviso legal
As informações e publicações não devem ser e não constituem conselhos ou recomendações financeiras, de investimento, de negociação ou de qualquer outro tipo, fornecidas ou endossadas pela TradingView. Leia mais em Termos de uso.