RSI Performance - TradingED
Key components of the original indicator:
● The Relative Strength Index ( RSI ) is a popular momentum oscillator developed in 1978.
● The RSI provides technical traders signals about bullish and bearish price momentum, and it is often plotted beneath the graph of an asset's price.
● An asset is usually considered overbought when the RSI is above 70% and oversold when it is below 30%.
It is a momentum indicator used in technical analysis that measures the magnitude of recent price changes to assess overbought or oversold conditions in the price of an asset. The RSI is displayed as an oscillator (a line chart moving between two extremes) and can read from 0 to 100. Overbought does not necessarily mean that the price will reverse lower, just as oversold does not mean that the price will reverse higher. Rather, the overbought and oversold conditions simply alert traders that the RSI is near the extremes of its recent readings.
Main functions of this modified indicator:
1) The SOURCE for the counts can be determined by the trader (close, open, etc).
2) You can select the type of MOVING AVERAGE, among many available options ( SMA , EMA , DEMA , HMA , etc.)
3) The MEASURE can be based on a CANDLES count if you are trading OHLC Charts from 1D onwards, or if your trading is intraday, you can also select counts by MINUTES, HOURS or DAYS, depending on your trading style.
4) LENGTH, by default it will be loaded as in the STRATEGY, but considering the previous point, you can modify it according to your convenience.
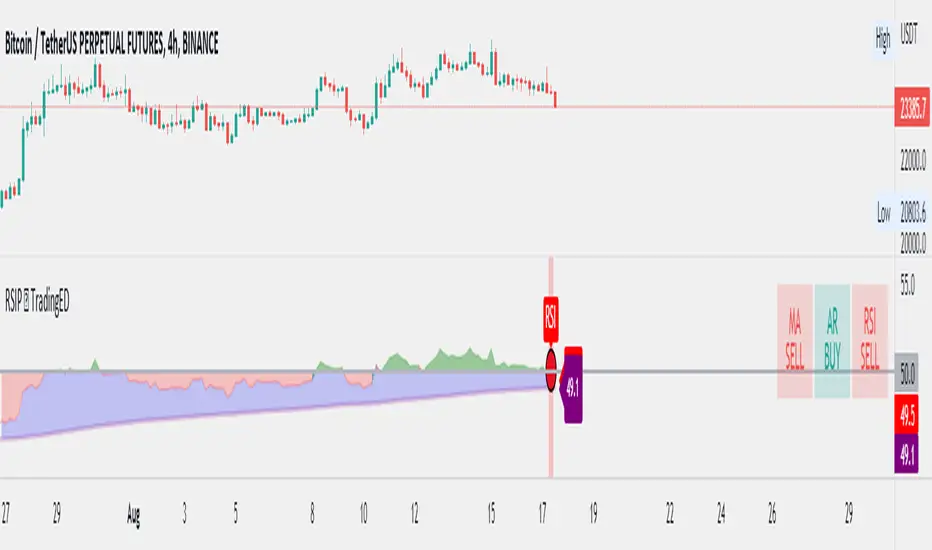
5) You have the option to hide or show a LABEL at the top of the chart, with respect to the signals: BULLISH green, BEARISH red.
Main performance functions of this modified indicator:
I) In the case of the PERFORMANCE that appears at the right of the chart, you have the option to adjust the WIDTH of each box.
II) The TEXT of the PERFORMANCE is not modifiable, but you can customize the default color. *
III) The BACKGROUND of the PERFORMANCE, you can customize the default color. *
IV) You have the option to hide or show a PERFORMANCE that appears at the right of the chart.
Main functions to customize the style of this indicator:
a) You can select the color for the ADJUSTED LEVEL and for the MOVING AVERAGE, with the colors that best suit you.
b) The CROSSOVER/CROSSUNDER signal between the MOVING AVERAGE and the ADJUSTED LEVEL can also be customized. *
c) For any type of SIGNAL, it is painted as a VERTICAL LINE in the graph, you can change the color that comes by default. *
d) In the case of the LABEL that appear at the top, the text is not modifiable, but you can customize both the type of label and change the default color. *
e) You can select the color for OVERVALUED and for UNDERVALUED levels, with the colors that best suit you.
f) You can select the colors for the BACKGROUND of the indicator according to the trend, whether it is BEARISH or BULLISH, with the colors that best suit you. *
* By default, they are marked as red for downtrends and green for uptrends.
Script sob convite
Somente usuários aprovados pelo autor podem acessar este script. Você precisará solicitar e obter permissão para usá-lo. Normalmente, essa permissão é concedida após o pagamento. Para obter mais detalhes, siga as instruções do autor abaixo ou entre em contato diretamente com Trading_ED.
A TradingView NÃO recomenda pagar ou usar um script, a menos que você confie totalmente em seu autor e entenda como ele funciona. Você também pode encontrar alternativas gratuitas e de código aberto em nossos scripts da comunidade.
Instruções do autor
Aviso legal
Script sob convite
Somente usuários aprovados pelo autor podem acessar este script. Você precisará solicitar e obter permissão para usá-lo. Normalmente, essa permissão é concedida após o pagamento. Para obter mais detalhes, siga as instruções do autor abaixo ou entre em contato diretamente com Trading_ED.
A TradingView NÃO recomenda pagar ou usar um script, a menos que você confie totalmente em seu autor e entenda como ele funciona. Você também pode encontrar alternativas gratuitas e de código aberto em nossos scripts da comunidade.