PROTECTED SOURCE SCRIPT
Multi-TF EMA(20) — Jcsatasiya
Overview
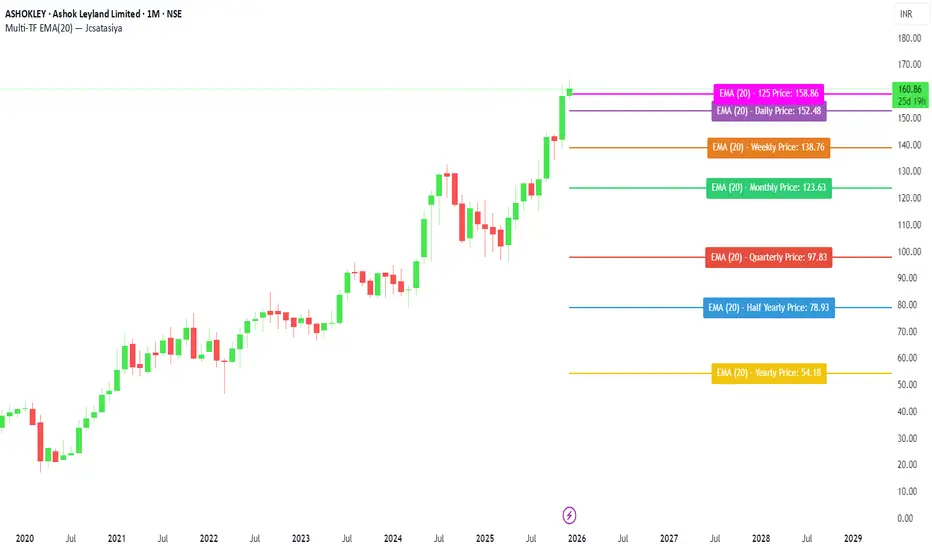
This indicator plots 7 multi-timeframe EMA(20) lines on any chart and displays a clean dynamic label for each EMA showing:
Full timeframe name (Yearly, Half-Yearly, Quarterly, Monthly, Weekly, etc.)
EMA(20) value formatted with exactly 2 decimals
A label that is positioned automatically to the right of the latest candle
White text for maximum readability
Color-coded lines for each timeframe
All EMA lines extend horizontally and update in real-time when new candles form on the selected timeframes.
✅ Key Features
• 7 Custom Timeframes
Choose any timeframe for each EMA (Yearly, 6-Month, 3-Month, Monthly, Weekly, Daily, 4H, etc.)
• Horizontal EMA Levels
Each EMA is drawn as a fixed horizontal level, making structure and bias easier to analyze.
• Dynamic Label Placement
Labels automatically position:
Horizontally: Left, Middle, or Right of the right-side future area
Vertically: Above, Middle, or Below the EMA line
• Clean Readable Labels
Always white text
Shows: EMA (20) – Timeframe Price: 123.45
Price always displays with 2 decimals
Label style auto-adjusts based on position
• Color Customization
Each timeframe EMA has its own color picker.
• All EMA Thickness Unified
Set one line thickness for all EMA lines.
• Reliable Multi-TF Accuracy
Uses request.security() with proper lookahead handling.
⭐ Why This Indicator Is Useful
This tool makes it extremely easy to visualize where your chart sits relative to major multi-timeframe EMA levels.
You immediately see:
Higher-timeframe trend direction
Bias zones
Key support/resistance EMA levels
Long-term vs short-term trend alignment
Price interaction with institutional EMAs
Perfect for day traders, swing traders, and position traders.
📘 HOW TO USE
1️⃣ Add to Chart
After adding the indicator, open the Settings → Inputs panel.
2️⃣ Choose the 7 Timeframes
For each slot, select your desired timeframe (example setup):
Yearly
Half Yearly
Quarterly
Monthly
Weekly
Daily
4H
3️⃣ Customize Colors
Pick a different color for each EMA for clarity.
4️⃣ Choose Label Placement
Use the label position controls:
Vertical: Upper / Middle / Below
Horizontal: Left / Middle / Right (relative to right-side future space)
5️⃣ Adjust Line Thickness (Optional)
A single slider controls the thickness of all 7 EMAs.
📝 NOTES
The indicator places labels 2–50 bars into the future depending on chosen position.
Labels are always visible and readable due to white text.
EMA values always show exactly two decimals, even for crypto, indices, and forex.
Works on any market and any chart timeframe.
Script protegido
Esse script é publicada como código fechado. No entanto, você pode gerenciar suas escolhas de bate-papo. Por favor, abra suas Configurações do perfil
Aviso legal
As informações e publicações não se destinam a ser, e não constituem, conselhos ou recomendações financeiras, de investimento, comerciais ou de outro tipo fornecidos ou endossados pela TradingView. Leia mais nos Termos de Uso.