OPEN-SOURCE SCRIPT
Fibonacci Trading Strategy (Auto Levels)
How It Works
Swing Highs and Lows Detection:
The script identifies the highest high and lowest low over a specified lookback period (default: 50 candles). These points are used as the basis for Fibonacci calculations.
Fibonacci Levels:
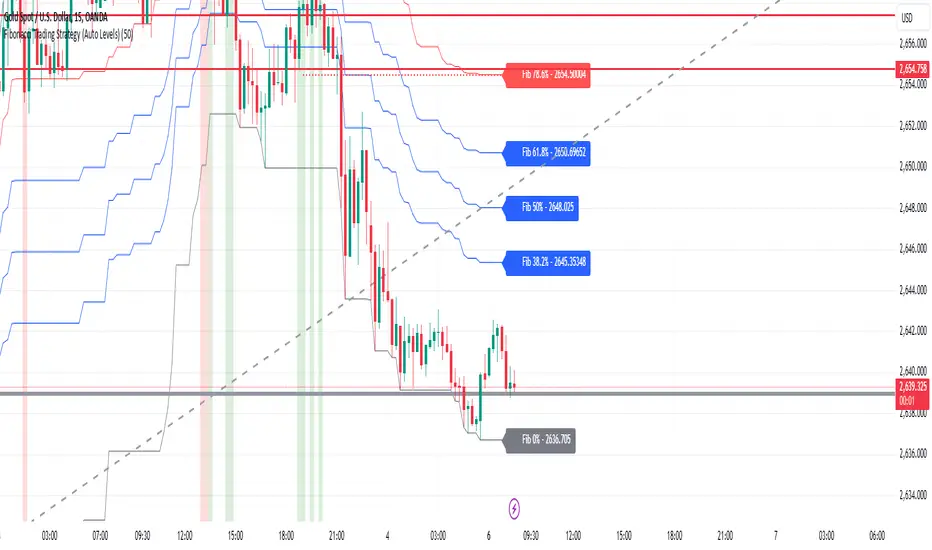
Fibonacci retracement levels: 0%, 38.2%, 50%, 61.8%, 78.6%, and 100%.
Fibonacci extension levels: 127.2%, 161.8%, 200%, 261.8%, and 361.8%.
Each level is plotted on the chart with a specific color and labeled with the corresponding price.
Entry Zones:
Pullback Area: Between the 50% and 61.8% retracement levels. This area is highlighted in green, indicating a potential entry for conservative traders.
Full Margin Area: Between the 61.8% and 78.6% retracement levels. This area is highlighted in red, suggesting a higher-risk entry for aggressive traders.
Stop Loss (SL):
The Stop Loss is placed at the 78.6% Fibonacci retracement level. A dotted red line is drawn at this level to provide a visual reference for risk management.
Entry labels include the Stop Loss price for clarity.
Take Profit (TP) Levels:
Multiple take-profit targets are identified using Fibonacci extension levels (127.2%, 161.8%, 200%, 261.8%, and 361.8%).
Each level is labeled with the price and target percentage.
Visual Aids:
The script dynamically labels each Fibonacci level with its corresponding price.
Entry points (Pullback and Full Margin) are marked with clear labels, including the recommended Stop Loss.
Background highlights help distinguish the Pullback and Full Margin areas.
Strategy Highlights
Risk Management:
Incorporates a well-defined Stop Loss at the 78.6% level to limit downside risk.
Multiple take-profit levels help traders scale out of positions gradually.
Automation:
Automatically recalculates levels when new swing highs or lows are detected, ensuring accuracy in dynamic markets.
Customizability:
Users can adjust the lookback period to suit different timeframes or trading styles.
Clarity:
Clean visuals and detailed labels ensure the strategy is easy to interpret and apply.
When to Use
The strategy is suitable for trend-following traders looking to enter during pullbacks in an established trend.
It works best in trending markets where Fibonacci levels often act as strong support or resistance.
Example Scenario
Bullish Setup:
Price retraces to the 50%-61.8% area (Pullback Area) after a swing high.
A buy order is placed in this zone, with the Stop Loss at the 78.6% level.
Profit targets are set at the 127.2%, 161.8%, and higher Fibonacci extensions.
Bearish Setup:
In a downtrend, price retraces upward to the 50%-61.8% zone.
A sell order is placed, with the Stop Loss at the 78.6% level and take-profit levels below.
Swing Highs and Lows Detection:
The script identifies the highest high and lowest low over a specified lookback period (default: 50 candles). These points are used as the basis for Fibonacci calculations.
Fibonacci Levels:
Fibonacci retracement levels: 0%, 38.2%, 50%, 61.8%, 78.6%, and 100%.
Fibonacci extension levels: 127.2%, 161.8%, 200%, 261.8%, and 361.8%.
Each level is plotted on the chart with a specific color and labeled with the corresponding price.
Entry Zones:
Pullback Area: Between the 50% and 61.8% retracement levels. This area is highlighted in green, indicating a potential entry for conservative traders.
Full Margin Area: Between the 61.8% and 78.6% retracement levels. This area is highlighted in red, suggesting a higher-risk entry for aggressive traders.
Stop Loss (SL):
The Stop Loss is placed at the 78.6% Fibonacci retracement level. A dotted red line is drawn at this level to provide a visual reference for risk management.
Entry labels include the Stop Loss price for clarity.
Take Profit (TP) Levels:
Multiple take-profit targets are identified using Fibonacci extension levels (127.2%, 161.8%, 200%, 261.8%, and 361.8%).
Each level is labeled with the price and target percentage.
Visual Aids:
The script dynamically labels each Fibonacci level with its corresponding price.
Entry points (Pullback and Full Margin) are marked with clear labels, including the recommended Stop Loss.
Background highlights help distinguish the Pullback and Full Margin areas.
Strategy Highlights
Risk Management:
Incorporates a well-defined Stop Loss at the 78.6% level to limit downside risk.
Multiple take-profit levels help traders scale out of positions gradually.
Automation:
Automatically recalculates levels when new swing highs or lows are detected, ensuring accuracy in dynamic markets.
Customizability:
Users can adjust the lookback period to suit different timeframes or trading styles.
Clarity:
Clean visuals and detailed labels ensure the strategy is easy to interpret and apply.
When to Use
The strategy is suitable for trend-following traders looking to enter during pullbacks in an established trend.
It works best in trending markets where Fibonacci levels often act as strong support or resistance.
Example Scenario
Bullish Setup:
Price retraces to the 50%-61.8% area (Pullback Area) after a swing high.
A buy order is placed in this zone, with the Stop Loss at the 78.6% level.
Profit targets are set at the 127.2%, 161.8%, and higher Fibonacci extensions.
Bearish Setup:
In a downtrend, price retraces upward to the 50%-61.8% zone.
A sell order is placed, with the Stop Loss at the 78.6% level and take-profit levels below.
Script de código aberto
Em verdadeiro espírito do TradingView, o criador deste script o tornou de código aberto, para que os traders possam revisar e verificar sua funcionalidade. Parabéns ao autor! Embora você possa usá-lo gratuitamente, lembre-se de que a republicação do código está sujeita às nossas Regras da Casa.
Aviso legal
As informações e publicações não se destinam a ser, e não constituem, conselhos ou recomendações financeiras, de investimento, comerciais ou de outro tipo fornecidos ou endossados pela TradingView. Leia mais nos Termos de Uso.