PROTECTED SOURCE SCRIPT
Atualizado Thunderbird Volcano & Waterfall Signals
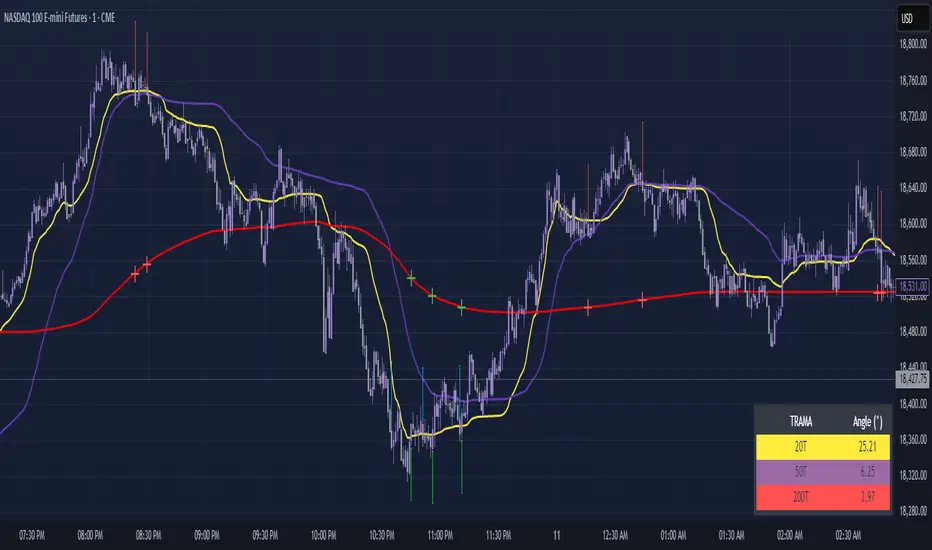
The Thunderbird Volcano & Waterfall signal Indicator is a strategy that incorporates the use of Price Action and TRAMA positioning to determine entry and exit points. There are 3 scenarios in which the indicator will signal an entry and exit if applicable. Keep in mind the suggested entry and exit points must be taken as consideration; further confirmations such as TRAMA pointing down or up, market structure, IFVG, etc. should be used in order for a successful trade.
Scenario 1 (SHORT) is the Thunderbird Volcano setup, TRAMA alignment is in accordance with the Volcano setup; A red arrow above will indicate entry when a candle closes below the 20T and a red cross will indicate the potential target at the 200T.
Scenario 2 (SHORT) is the Thunderbird Waterfall setup, TRAMA alignment is in accordance with the Waterfall setup; A blue arrow above will indicate entry when a candle closes below all 3 TRAMAs after corresponding position is established. Target is not indicated and can vary according to user specification.
Scenario 3 (LONG) is the Inverse Volcano setup, TRAMA alignment is in accordance with the Inverse Volcano setup. A green arrow will indicate entry below when a candle closes above the 20T and a green cross will indicate the potential target at the 200T.
Notas de Lançamento
The Thunderbird Volcano & Waterfall signal Indicator is a strategy that incorporates the use of Price Action and TRAMA positioning to determine entry and exit points. There are 3 scenarios in which the indicator will signal an entry and exit if applicable. Keep in mind the suggested entry and exit points must be taken as consideration; further confirmations such as TRAMA pointing down or up, market structure, IFVG, etc. should be used in order for a successful trade.Scenario 1 (SHORT) is the Thunderbird Volcano setup, TRAMA alignment is in accordance with the Volcano setup; A red arrow above will indicate entry when a candle closes below the 20T and a red cross will indicate the potential target at the 200T.
Scenario 2 (SHORT) is the Thunderbird Waterfall setup, TRAMA alignment is in accordance with the Waterfall setup; A blue arrow above will indicate entry when a candle closes below all 3 TRAMAs after corresponding position is established. Target is not indicated and can vary according to user specification.
Scenario 3 (LONG) is the Thunderbird Inverse Volcano setup, TRAMA alignment is in accordance with the Inverse Volcano setup. A green arrow will indicate entry below when a candle closes above the 20T and a green cross will indicate the potential target at the 200T.
Notas de Lançamento
The Thunderbird Volcano & Waterfall signal Indicator is a strategy that incorporates the use of Price Action and TRAMA positioning to determine entry and exit points. There are 3 scenarios in which the indicator will signal an entry and exit if applicable. Keep in mind the suggested entry and exit points must be taken as consideration; further confirmations such as TRAMA pointing down or up, market structure, IFVG, etc. should be used in order for a successful trade.Scenario 1 (SHORT) is the Thunderbird Volcano setup, TRAMA alignment is in accordance with the Volcano setup; A red arrow above will indicate entry when a candle closes below the 20T and a red cross will indicate the potential target at the 200T.
Scenario 2 (SHORT) is the Thunderbird Waterfall setup, TRAMA alignment is in accordance with the Waterfall setup; A blue arrow above will indicate entry when a candle closes below all 3 TRAMAs after corresponding position is established. Target is not indicated and can vary according to user specification.
Scenario 3 (LONG) is the Inverse Volcano setup, TRAMA alignment is in accordance with the Inverse Volcano setup. A green arrow will indicate entry below when a candle closes above the 20T and a green cross will indicate the potential target at the 200T.
V2 Update:
-Includes TRAMA angle table in degrees to monitor current TRAMA angle for confirmed trend.
-User adjustable settings to show/hide selected scenarios on the chart.
Notas de Lançamento
Updated script for arrow placements.Script protegido
Esse script é publicada como código fechado. No entanto, você pode gerenciar suas escolhas de bate-papo. Por favor, abra suas Configurações do perfil
Aviso legal
As informações e publicações não se destinam a ser, e não constituem, conselhos ou recomendações financeiras, de investimento, comerciais ou de outro tipo fornecidos ou endossados pela TradingView. Leia mais nos Termos de Uso.
Script protegido
Esse script é publicada como código fechado. No entanto, você pode gerenciar suas escolhas de bate-papo. Por favor, abra suas Configurações do perfil
Aviso legal
As informações e publicações não se destinam a ser, e não constituem, conselhos ou recomendações financeiras, de investimento, comerciais ou de outro tipo fornecidos ou endossados pela TradingView. Leia mais nos Termos de Uso.