OPEN-SOURCE SCRIPT
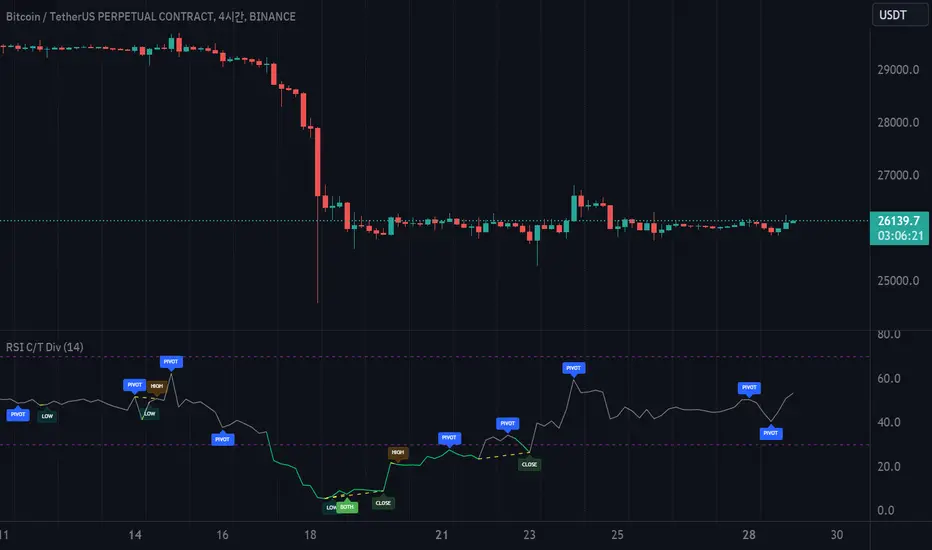
Atualizado RSI with Close & Tail Divergences

RSI divergence is a cornerstone signal for both stock and cryptocurrency traders, renowned for its reliability.
The basis for measuring divergence can vary:
Depending on the criteria selected, the resultant signals can be markedly different.
Our innovative indicator offers:
With this tool, traders are empowered to make informed decisions, anchored in precise divergence cues.
This indicator boasts the following capabilities:

The basis for measuring divergence can vary:
- Historically, it's been determined by the candlestick's closing price.
- However, a contemporary approach uses the tail values, specifically the high and low prices, of the candlestick.
Depending on the criteria selected, the resultant signals can be markedly different.
Our innovative indicator offers:
- Divergence tracking based on the closing price of the candlestick.
- Divergence tracking considering the candlestick's peak and trough values.
- A unique convergence of both types of divergence signals.
With this tool, traders are empowered to make informed decisions, anchored in precise divergence cues.
This indicator boasts the following capabilities:
- Displays divergence based on closing price, highs/lows, as well as a unique combined criterion.
- Highlights pivot points.
- Denotes divergence spots on the RSI chart with lines.
- Offers a background color representation instead of labels.
Notas de Lançamento
RSI divergence is a cornerstone signal for both stock and cryptocurrency traders, renowned for its reliability.The basis for measuring divergence can vary:
- Historically, it's been determined by the candlestick's closing price.
- However, a contemporary approach uses the tail values, specifically the high and low prices, of the candlestick.
Depending on the criteria selected, the resultant signals can be markedly different.
Our innovative indicator offers:
- Divergence tracking based on the closing price of the candlestick.
- Divergence tracking considering the candlestick's peak and trough values.
- A unique convergence of both types of divergence signals.
With this tool, traders are empowered to make informed decisions, anchored in precise divergence cues.
This indicator boasts the following capabilities:
- Displays divergence based on closing price, highs/lows, as well as a unique combined criterion.
- Highlights pivot points.
- Denotes divergence spots on the RSI chart with lines.
- Offers a background color representation instead of labels.
Script de código aberto
Em verdadeiro espírito do TradingView, o criador deste script o tornou de código aberto, para que os traders possam revisar e verificar sua funcionalidade. Parabéns ao autor! Embora você possa usá-lo gratuitamente, lembre-se de que a republicação do código está sujeita às nossas Regras da Casa.
Aviso legal
As informações e publicações não se destinam a ser, e não constituem, conselhos ou recomendações financeiras, de investimento, comerciais ou de outro tipo fornecidos ou endossados pela TradingView. Leia mais nos Termos de Uso.