PROTECTED SOURCE SCRIPT
Tradewind EMAs + Conditions
Tradewind EMAs + Conditions
Overview
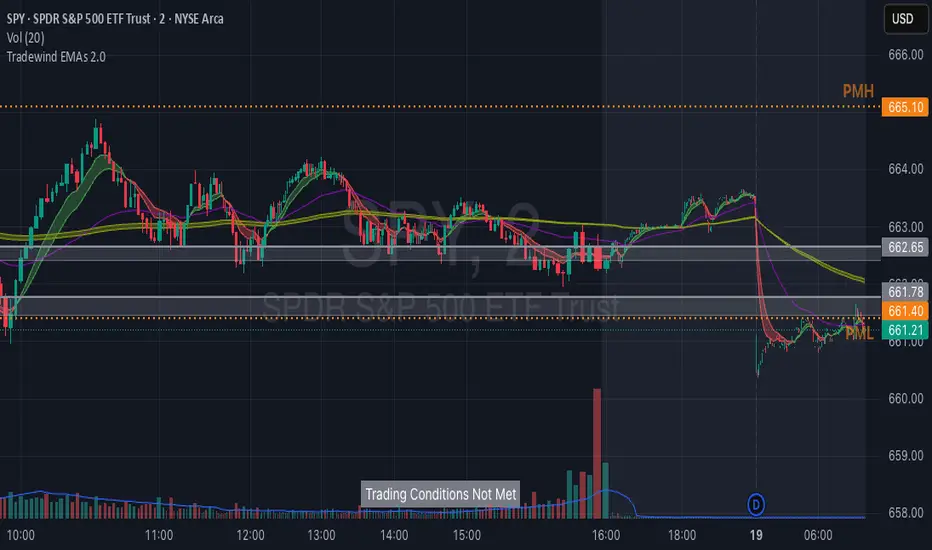
The Tradewind EMAs + Conditions indicator is a powerful tool designed for traders who want to monitor key price levels and trend signals on a single chart. It combines a Trading Conditions monitor that identifies significant price breakouts based on prior day and premarket levels with an EMA Ribbons system that visualizes multiple Exponential Moving Averages (EMAs) for trend analysis.This indicator is tailored for day traders, particularly those using fast-paced setups to capitalize on short-term trends and breakouts, with customizable visual elements to suit individual preferences.
Features
1. Trading Conditions Monitor
Purpose: Identifies when the price breaks out of key levels on a 15-minute chart, considering the prior day's high/low (PDH/PDL) and the premarket high/low (PMH/PML), aligning with @team2trading's focus on key levels for trend identification.
Logic:
Monitors the most recent closed 15-minute bar to detect crosses above PDH/PMH (bullish) or below PDL/PML (bearish).
Ensures the price is outside the premarket band (above PMH or below PML) at the 15-minute close.
Optionally requires the current day's premarket session to be complete for stricter signal validation.
Display: Shows a customizable banner with the text "Trading Conditions Met" (green background) or "Trading Conditions Not Met" (gray background).
Alerts: Includes an alert condition that triggers when trading conditions are met, allowing notifications for breakouts.
2. EMA Ribbons
Purpose: Visualizes multiple EMAs to confirm trend direction and strength, directly supporting use of the primary 13, 48, and 200 EMAs for trend analysis and pullback entries.
Components:
Fast EMAs (EMA1 and EMA2): Default lengths of 8 and 13, with dynamic coloring (green for bullish when EMA1 > EMA2, red for bearish when EMA1 < EMA2).
Intermediate EMA (EMA3): Default length of 48, with a user-defined color.
Slow EMAs (EMA4 and EMA5): Default lengths of 200 and 220, with a user-defined color.
Cloud Fills: Displays editable cloud fills between EMA1/EMA2 and EMA4/EMA5 to highlight trend strength and crossovers.
Visualization: Each EMA is plotted as a line, with customizable colors and lengths, and clouds provide a clear visual of trend direction.
3. Customization Options
Premarket Session: Define the premarket session time (default: 04:00–09:30, exchange time) to calculate PMH/PML.
Premarket Strictness: Toggle to require the current day's premarket to be complete for signal validation.
Banner Position: Choose from five positions (Top Right, Bottom Right, Middle Right, Bottom Center, Middle Left) to place the trading conditions banner.
Banner Size: Select Small (1x1), Medium (2x1), or Large (3x2) for the banner's dimensions.
EMA Settings: Adjust the lengths and colors of all five EMAs and their respective cloud fills to match your trading style.
4. 2-Minute Trading Strategy Support
Purpose: Enhances the indicator for 2-minute trading strategy, which focuses on identifying trends, entering on pullbacks to EMAs, and using key levels for high-probability trades on a 2-minute chart.
How It Works:
Objective: The strategy aims to identify trending stocks and enter trades on pullbacks to the 13 or 48 EMA, using the 2-minute timeframe for entries and exits. The indicator's EMAs (default 8, 13, 48, 200, 220)
Trend Identification:
EMA Alignment: The indicator's EMA ribbons confirm trend direction. A bullish trend is signaled when the price is above the 200 EMA and the 13 EMA crosses above the 48 EMA (green cloud for EMA1/EMA2). A bearish trend occurs when the price is below the 200 EMA and the 13 EMA crosses below the 48 EMA (red cloud). Flat EMAs indicate choppy conditions, where no trades are taken.
Key Levels: The indicator plots PDH/PDL and PMH/PML, which uses to gauge trend strength. Breakouts or retests of these levels (shown by the "Trading Conditions Met" banner) confirm momentum for trade entries.
Entry Rules: On a 2-minute chart, enter trades on pullbacks to the 13 or 48 EMA when the "Trading Conditions Met" banner confirms a breakout above PDH/PMH (long) or below PDL/PML (short). Use candlestick patterns (e.g., bull/bear flags, top/bottom wicks) or level retests for additional confirmation.
Trade Management: Trail stops using the 13 EMA to lock in profits, scaling out when the price extends far from the 13 EMA to protect gains. The slow EMAs (200, 220) help identify potential reversal zones or longer-term trend context.
Risk Management: The indicator's breakout logic provides clear risk levels (e.g., a candle close below the entry EMA for longs or above for shorts), aligning with @team2trading's low-risk, high-reward approach.
Best Practices: Apply the indicator on a 2-minute chart for stocks like SPY,
SPY,  QQQ, or $IWM. Set alerts for "Trading Conditions Met" to catch breakouts in real-time. Adjust EMA lengths (e.g., set EMA1 to 13 and EMA2 to 48) to match the strategy exactly if preferred.
How to Use
Add to Chart: Apply the indicator to a 2-minute or 15-minute TradingView chart for optimal use with 2-minute strategy or breakout monitoring.
Configure Settings:
Adjust the premarket session, EMA lengths, colors, banner position, and size in the settings panel.
Enable the "Only consider today's premarket" option for stricter breakout signals.
Monitor Signals:
Watch the banner for "Trading Conditions Met" to identify breakout opportunities on the 2-minute chart.
Use the EMA ribbons and clouds to confirm trend direction and enter on pullbacks to the 13 or 48 EMA.
Set Alerts: Create alerts for the "Trading Conditions Met" condition to receive notifications for potential trade setups.
Settings
Trading Conditions:
Premarket Session: Set the time range for premarket data.
Only consider today's premarket: Enable for stricter signal logic.
Banner Settings:
Table Position: Select the banner's chart location.
Table Size: Choose the banner's size.
Fast EMAs: Set lengths and colors for EMA1, EMA2, and their cloud.
Intermediate EMA: Set length and color for EMA3.
Slow EMAs: Set lengths and colors for EMA4, EMA5, and their cloud.
Notes
The indicator is overlay-based, ensuring seamless integration with your price chart.
While the trading conditions logic uses 15-minute bar data, it can be monitored on a 2-minute chart for faster execution.
EMA Ribbons, with clouds highlighting crossover zones, are ideal for confirming trends and pullbacks in the 2-minute strategy.
Use the customizable banner to avoid chart clutter and position it for optimal visibility.
Credits
Developed by Tradewind Group. Combining breakout logic with EMA-based trend visualization, with direct inspiration from @team2trading's 2-minute trading strategy for identifying trends and low-risk entries.
Overview
The Tradewind EMAs + Conditions indicator is a powerful tool designed for traders who want to monitor key price levels and trend signals on a single chart. It combines a Trading Conditions monitor that identifies significant price breakouts based on prior day and premarket levels with an EMA Ribbons system that visualizes multiple Exponential Moving Averages (EMAs) for trend analysis.This indicator is tailored for day traders, particularly those using fast-paced setups to capitalize on short-term trends and breakouts, with customizable visual elements to suit individual preferences.
Features
1. Trading Conditions Monitor
Purpose: Identifies when the price breaks out of key levels on a 15-minute chart, considering the prior day's high/low (PDH/PDL) and the premarket high/low (PMH/PML), aligning with @team2trading's focus on key levels for trend identification.
Logic:
Monitors the most recent closed 15-minute bar to detect crosses above PDH/PMH (bullish) or below PDL/PML (bearish).
Ensures the price is outside the premarket band (above PMH or below PML) at the 15-minute close.
Optionally requires the current day's premarket session to be complete for stricter signal validation.
Display: Shows a customizable banner with the text "Trading Conditions Met" (green background) or "Trading Conditions Not Met" (gray background).
Alerts: Includes an alert condition that triggers when trading conditions are met, allowing notifications for breakouts.
2. EMA Ribbons
Purpose: Visualizes multiple EMAs to confirm trend direction and strength, directly supporting use of the primary 13, 48, and 200 EMAs for trend analysis and pullback entries.
Components:
Fast EMAs (EMA1 and EMA2): Default lengths of 8 and 13, with dynamic coloring (green for bullish when EMA1 > EMA2, red for bearish when EMA1 < EMA2).
Intermediate EMA (EMA3): Default length of 48, with a user-defined color.
Slow EMAs (EMA4 and EMA5): Default lengths of 200 and 220, with a user-defined color.
Cloud Fills: Displays editable cloud fills between EMA1/EMA2 and EMA4/EMA5 to highlight trend strength and crossovers.
Visualization: Each EMA is plotted as a line, with customizable colors and lengths, and clouds provide a clear visual of trend direction.
3. Customization Options
Premarket Session: Define the premarket session time (default: 04:00–09:30, exchange time) to calculate PMH/PML.
Premarket Strictness: Toggle to require the current day's premarket to be complete for signal validation.
Banner Position: Choose from five positions (Top Right, Bottom Right, Middle Right, Bottom Center, Middle Left) to place the trading conditions banner.
Banner Size: Select Small (1x1), Medium (2x1), or Large (3x2) for the banner's dimensions.
EMA Settings: Adjust the lengths and colors of all five EMAs and their respective cloud fills to match your trading style.
4. 2-Minute Trading Strategy Support
Purpose: Enhances the indicator for 2-minute trading strategy, which focuses on identifying trends, entering on pullbacks to EMAs, and using key levels for high-probability trades on a 2-minute chart.
How It Works:
Objective: The strategy aims to identify trending stocks and enter trades on pullbacks to the 13 or 48 EMA, using the 2-minute timeframe for entries and exits. The indicator's EMAs (default 8, 13, 48, 200, 220)
Trend Identification:
EMA Alignment: The indicator's EMA ribbons confirm trend direction. A bullish trend is signaled when the price is above the 200 EMA and the 13 EMA crosses above the 48 EMA (green cloud for EMA1/EMA2). A bearish trend occurs when the price is below the 200 EMA and the 13 EMA crosses below the 48 EMA (red cloud). Flat EMAs indicate choppy conditions, where no trades are taken.
Key Levels: The indicator plots PDH/PDL and PMH/PML, which uses to gauge trend strength. Breakouts or retests of these levels (shown by the "Trading Conditions Met" banner) confirm momentum for trade entries.
Entry Rules: On a 2-minute chart, enter trades on pullbacks to the 13 or 48 EMA when the "Trading Conditions Met" banner confirms a breakout above PDH/PMH (long) or below PDL/PML (short). Use candlestick patterns (e.g., bull/bear flags, top/bottom wicks) or level retests for additional confirmation.
Trade Management: Trail stops using the 13 EMA to lock in profits, scaling out when the price extends far from the 13 EMA to protect gains. The slow EMAs (200, 220) help identify potential reversal zones or longer-term trend context.
Risk Management: The indicator's breakout logic provides clear risk levels (e.g., a candle close below the entry EMA for longs or above for shorts), aligning with @team2trading's low-risk, high-reward approach.
Best Practices: Apply the indicator on a 2-minute chart for stocks like
How to Use
Add to Chart: Apply the indicator to a 2-minute or 15-minute TradingView chart for optimal use with 2-minute strategy or breakout monitoring.
Configure Settings:
Adjust the premarket session, EMA lengths, colors, banner position, and size in the settings panel.
Enable the "Only consider today's premarket" option for stricter breakout signals.
Monitor Signals:
Watch the banner for "Trading Conditions Met" to identify breakout opportunities on the 2-minute chart.
Use the EMA ribbons and clouds to confirm trend direction and enter on pullbacks to the 13 or 48 EMA.
Set Alerts: Create alerts for the "Trading Conditions Met" condition to receive notifications for potential trade setups.
Settings
Trading Conditions:
Premarket Session: Set the time range for premarket data.
Only consider today's premarket: Enable for stricter signal logic.
Banner Settings:
Table Position: Select the banner's chart location.
Table Size: Choose the banner's size.
Fast EMAs: Set lengths and colors for EMA1, EMA2, and their cloud.
Intermediate EMA: Set length and color for EMA3.
Slow EMAs: Set lengths and colors for EMA4, EMA5, and their cloud.
Notes
The indicator is overlay-based, ensuring seamless integration with your price chart.
While the trading conditions logic uses 15-minute bar data, it can be monitored on a 2-minute chart for faster execution.
EMA Ribbons, with clouds highlighting crossover zones, are ideal for confirming trends and pullbacks in the 2-minute strategy.
Use the customizable banner to avoid chart clutter and position it for optimal visibility.
Credits
Developed by Tradewind Group. Combining breakout logic with EMA-based trend visualization, with direct inspiration from @team2trading's 2-minute trading strategy for identifying trends and low-risk entries.
Script protegido
Esse script é publicada como código fechado. No entanto, você pode gerenciar suas escolhas de bate-papo. Por favor, abra suas Configurações do perfil
Aviso legal
As informações e publicações não se destinam a ser, e não constituem, conselhos ou recomendações financeiras, de investimento, comerciais ou de outro tipo fornecidos ou endossados pela TradingView. Leia mais nos Termos de Uso.