OPEN-SOURCE SCRIPT
Atualizado PE Band

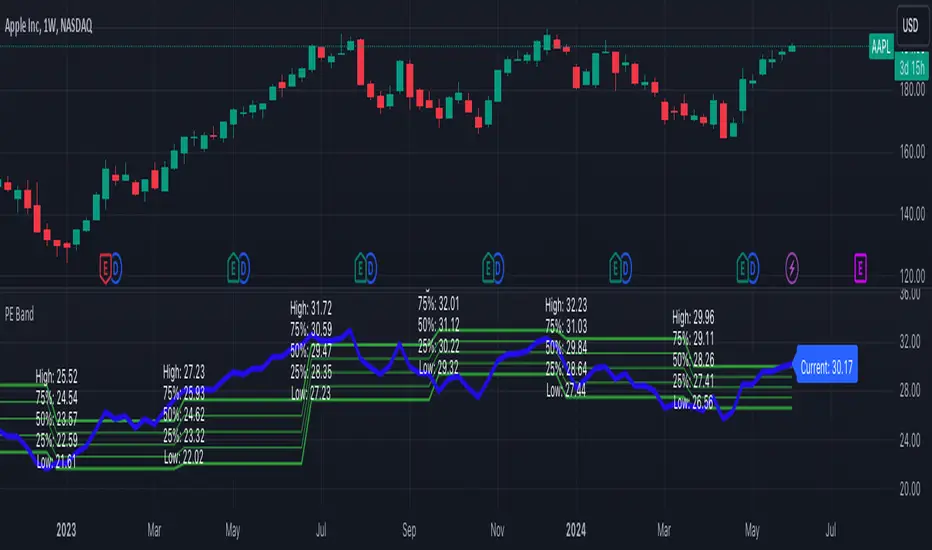
The PE Band shows the highest and lowest P/E in the previous period with TTM EPS. If the current P/E is lower than the minimum P/E, it is considered cheap. In other words, higher than the maximum P/E is considered expensive.
PE Band consists of 2 lines.
- Firstly, the historical P/E value in "green" (if TTM EPS is positive) or "red" (if TTM EPS is negative) states will change according to the latest high or low price of TTM EPS, such as: :
After the second quarter of 2023 (end of June), how do prices from 1 July – 30 September reflect net profits? The program will get the highest and lowest prices during that time.
After the 3rd quarter of 2023 (end of September), how do prices from 1 Oct. - 31 Dec. reflect net profits? The program will get the highest and lowest prices during that time.
- Second, the blue line is the closing price divided by TTM EPS, which shows the current P/E.
Notas de Lançamento
1. Change from "EARNINGS_PER_SHARE" to "EARNINGS_PER_SHARE_DILUTED"2. Add more lines of 75% P/E and 25% P/E
Notas de Lançamento
to solve Error on bar 5000 as comment - Add attribute "calc_bars_count = 5000" in indicator
Script de código aberto
Em verdadeiro espírito do TradingView, o criador deste script o tornou de código aberto, para que os traders possam revisar e verificar sua funcionalidade. Parabéns ao autor! Embora você possa usá-lo gratuitamente, lembre-se de que a republicação do código está sujeita às nossas Regras da Casa.
Aviso legal
As informações e publicações não se destinam a ser, e não constituem, conselhos ou recomendações financeiras, de investimento, comerciais ou de outro tipo fornecidos ou endossados pela TradingView. Leia mais nos Termos de Uso.