OPEN-SOURCE SCRIPT
Atualizado Pragmatic risk management
INTRO
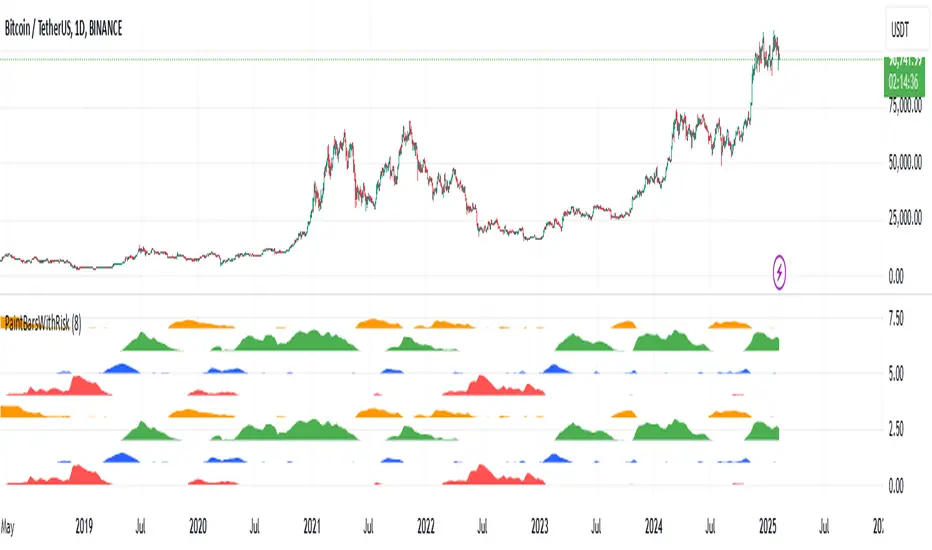
The indicator is calculating multiple moving averages on the value of price change %. It then combines the normalized (via arctan function) values into a single normalized value (via simple average).
The total error from the center of gravity and the angle in which the error is accumulating represented by 4 waves:
BLUE = Good for chance for price to go up
GREEN = Good chance for price to continue going up
ORANGE = Good chance for price to go down
RED = Good chance for price to continue going down
A full cycle of ORANGE\RED\BLUE\GREEN colors will ideally lead to the exact same cycle, if not, try to understand why.
NOTICE-
This indicator is calculating large time-windows so It can be heavy on your device. Tested on PC browser only.
My visual setup:
1. Add two indicators on-top of each other and merge their scales (It will help out later).
2. Zoom out price chart to see the maximum possible data.
3. Set different colors for both indicators for simple visual seperation.
4. Choose 2 different values, one as high as possible and one as low as possible.
(Possible - the indicator remains effective at distinguishing the cycle).
Manual calibration:
0. Select a fixed chart resolution (2H resolution minimum recommended).
1. Change the "mul2" parameter in ranges between 4-15 .
2. Observe the "Turning points" of price movement. (Typically when RED\GREEN are about to switch.)
2. Perform a segmentation of time slices and find cycles. No need to be exact!
3. Draw a square on price movement at place and color as the dominant wave currently inside the indicator.
This procedure should lead to a full price segmentation with easier anchoring.
Notas de Lançamento
Change bar color based on most dominant wave.Notas de Lançamento
Update script to V5Notas de Lançamento
Added a clone of the bottom 4 waves above the previous 4 waves to emphasize that it doesn't matter which color is the "top" and which color is the "bottom". You can start your analysis from any color and move up\downScript de código aberto
Em verdadeiro espírito do TradingView, o criador deste script o tornou de código aberto, para que os traders possam revisar e verificar sua funcionalidade. Parabéns ao autor! Embora você possa usá-lo gratuitamente, lembre-se de que a republicação do código está sujeita às nossas Regras da Casa.
Aviso legal
As informações e publicações não se destinam a ser, e não constituem, conselhos ou recomendações financeiras, de investimento, comerciais ou de outro tipo fornecidos ou endossados pela TradingView. Leia mais nos Termos de Uso.
Script de código aberto
Em verdadeiro espírito do TradingView, o criador deste script o tornou de código aberto, para que os traders possam revisar e verificar sua funcionalidade. Parabéns ao autor! Embora você possa usá-lo gratuitamente, lembre-se de que a republicação do código está sujeita às nossas Regras da Casa.
Aviso legal
As informações e publicações não se destinam a ser, e não constituem, conselhos ou recomendações financeiras, de investimento, comerciais ou de outro tipo fornecidos ou endossados pela TradingView. Leia mais nos Termos de Uso.