OPEN-SOURCE SCRIPT
expected range STUDY
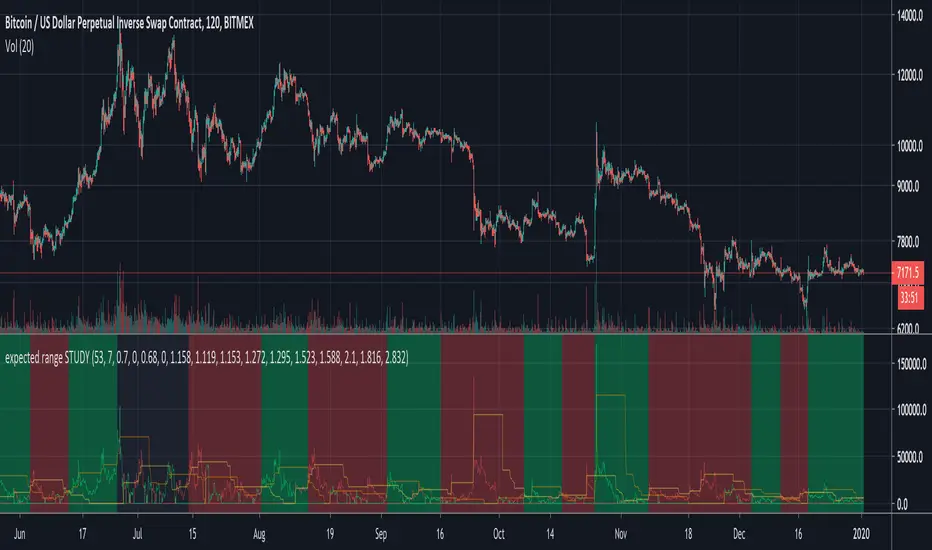
This is an indicator that measures how much price movement (low to high) we've seen in a set of 1 bar back, 2 bars back, 3 bars back, 5 bars back, 8 bars back using the Fibonacci sequence up to 89 bars back, and then measures how low or high within each range we are, sort of like giving a rating of 0 for sitting on the lower Bollinger Band and a rating of 100 for sitting on the higher Bollinger band. It combines all the data and weights the data by the historical strength of signal from each length of bands. It's been tuned to a 2 hour XBTUSD chart, but it could be used on other things and other timeframes too. Some tweaking would be needed, though. The final result works more like a trend following indictor than and indicator that tries to pick an exact trend reversal point. However, you're free to use it how you want. Frequently you get a nice red or green spike up showing you when the bottom or top is in, but sometimes those spikes are just the start of an extended down move or up move.
On the chart, a buy (long) signal is generated when the green line crosses up above the orange line. To make it extra clear the background is green when you should be long. A sell (short) signal is generated with the red line crosses up above the yellow line. The background will be red when you should be short. If the background is black, it's indicating a profit of over 53% was taken and it's waiting for another trade to start. Up to you to take profit or keep riding your trade.
For XBTUSD trades, a full take profit on any trade exceeding 53% gains works nice (on 1x leverage) and a stoploss of -7% works quite nicely too. One could use this on up to 2x leverage but I wouldn't recommend going much higher. Have fun. Trade carefully. Don't get rekt.
I will release the "expected range STRATEGY" to go along with this so you can do your own backtesting.
Disclaimer: I haven't tested the alerts, but they should work. Use at your own risk.
Script de código aberto
Em verdadeiro espírito do TradingView, o criador deste script o tornou de código aberto, para que os traders possam revisar e verificar sua funcionalidade. Parabéns ao autor! Embora você possa usá-lo gratuitamente, lembre-se de que a republicação do código está sujeita às nossas Regras da Casa.
Aviso legal
As informações e publicações não se destinam a ser, e não constituem, conselhos ou recomendações financeiras, de investimento, comerciais ou de outro tipo fornecidos ou endossados pela TradingView. Leia mais nos Termos de Uso.