PROTECTED SOURCE SCRIPT
Atualizado Support and Resistance Lines [Swastik]

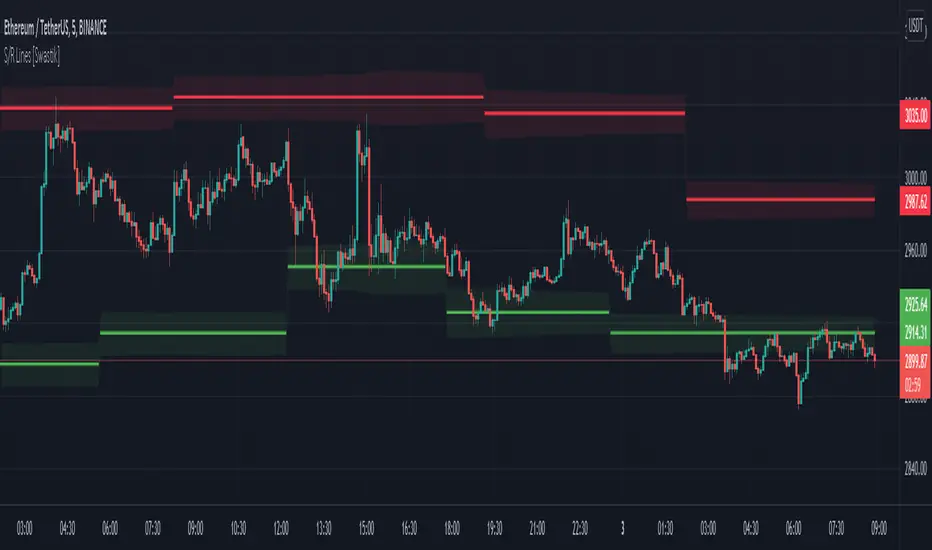
This indicator plots support and resistance lines automatically on the basis of the pivots created by the swings in the market.
You can increase the swing sensitivity if you want it to detect only larger swings.
There is a range drawn around the support and resistance lines based on the volatility of the market.
This works on every timeframe and the lines are drawn on the basis of swings in that timeframe.
This does not repaints and you can use it freely.
Notas de Lançamento
Added the alert conditions for crossing of the Support and Resistance LinesScript protegido
Esse script é publicada como código fechado. No entanto, você pode gerenciar suas escolhas de bate-papo. Por favor, abra suas Configurações do perfil
Aviso legal
As informações e publicações não se destinam a ser, e não constituem, conselhos ou recomendações financeiras, de investimento, comerciais ou de outro tipo fornecidos ou endossados pela TradingView. Leia mais nos Termos de Uso.
Script protegido
Esse script é publicada como código fechado. No entanto, você pode gerenciar suas escolhas de bate-papo. Por favor, abra suas Configurações do perfil
Aviso legal
As informações e publicações não se destinam a ser, e não constituem, conselhos ou recomendações financeiras, de investimento, comerciais ou de outro tipo fornecidos ou endossados pela TradingView. Leia mais nos Termos de Uso.