OPEN-SOURCE SCRIPT
Atualizado [blackcat] L1 True Range Adjusted EMA (TRAdj EMA)
Level: 1
Background
In Traders’ Tips in January 2023, Vitali Apirine published an article in the January 2023 issue, “True Range Adjusted Exponential Moving Average (TRAdj EMA)”.
I use pine v4 to script it.
Function
Vitali Apirine's article True Range Adjusted Exponential Moving Average (TRAdj EMA) presents how a security's True Range, which measures volatility, can be integrated into a traditional exponential moving average. The trend following indicator called True Range Adjusted Exponential Moving Average (TRAdj EMA) applied with different lengths can help define turning points and filter price movements. By comparing the indicator to an exponential moving average of the same length, the trader can gain insight into the overall trend.
Remarks
Feedbacks are appreciated.
Notas de Lançamento
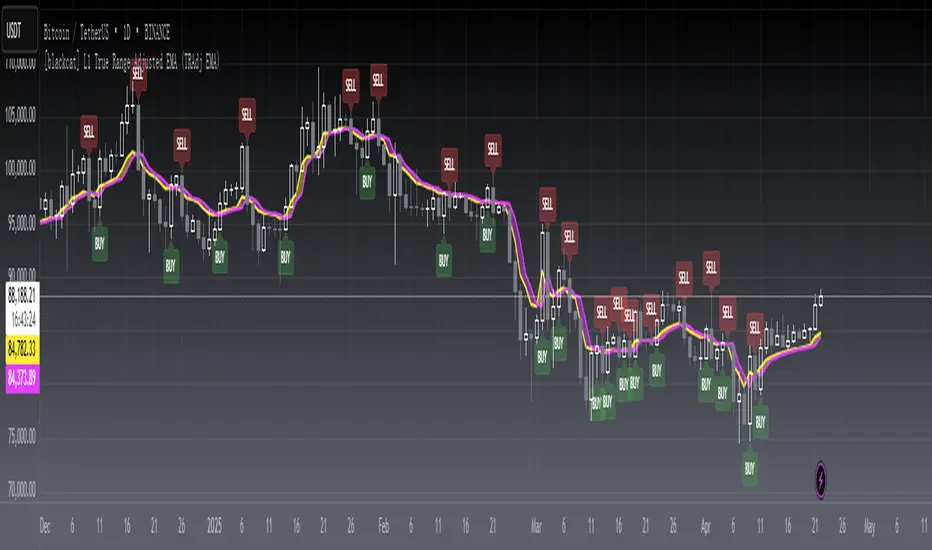
OVERVIEWThe L1 True Range Adjusted EMA is a sophisticated technical indicator designed to enhance traditional EMA calculations by incorporating price volatility through True Range adjustments. This indicator creates dynamic moving averages that adapt to market conditions, providing more responsive trend-following signals than standard EMAs. 📈
FEATURES
• Dynamic EMA calculation based on price volatility
• Adjustable parameters for customization:
Periods: Controls the smoothing factor
PDS: Defines the period range for True Range analysis
Multiplier: Determines sensitivity to price movement • Visual representation with customizable colors and fill patterns • Automated trading signals with alerts
HOW TO USE
Parameter Setup
Adjust periods for desired smoothness level
Fine-tune pds to match your timeframe preference
Modify multiplier to control responsiveness
Interpretation
Green/Red fills indicate bullish/bearish momentum
Crossovers generate buy/sell signals
Monitor signal labels for trade opportunities
Integration
Add alerts for automated notifications
Combine with other indicators for confirmation
Backtest strategies using historical data
LIMITATIONS
• Requires sufficient historical data for accurate calculations
• May produce false signals during highly volatile markets
• Best suited for medium-term to long-term trading strategies
NOTES
✅ The indicator uses both fast and slow lines for enhanced analysis
✅ Color-coded alerts provide visual confirmation of signals
✅ Customizable appearance allows integration into existing setups
Script de código aberto
Em verdadeiro espírito do TradingView, o criador deste script o tornou de código aberto, para que os traders possam revisar e verificar sua funcionalidade. Parabéns ao autor! Embora você possa usá-lo gratuitamente, lembre-se de que a republicação do código está sujeita às nossas Regras da Casa.
Avoid losing contact!Don't miss out! The first and most important thing to do is to join my Discord chat now! Click here to start your adventure: discord.com/invite/ZTGpQJq 防止失联,请立即行动,加入本猫聊天群: discord.com/invite/ZTGpQJq
Aviso legal
As informações e publicações não se destinam a ser, e não constituem, conselhos ou recomendações financeiras, de investimento, comerciais ou de outro tipo fornecidos ou endossados pela TradingView. Leia mais nos Termos de Uso.