OPEN-SOURCE SCRIPT
Price Prediction With Rolling Volatility [TradeDots]
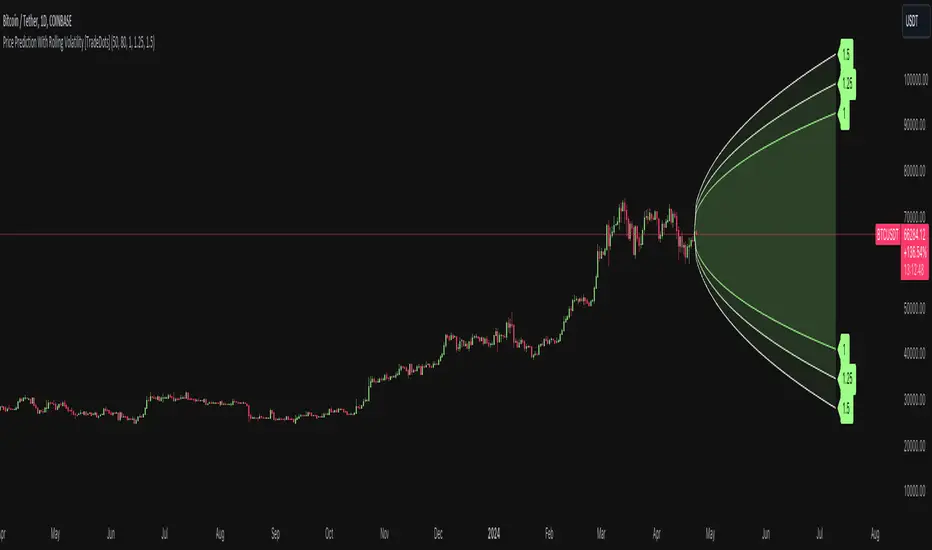
The "Price Prediction With Rolling Volatility" is a trading indicator that estimates future price ranges based on the volatility of price movements within a user-defined rolling window.
HOW DOES IT WORK
This indicator utilizes 3 types of user-provided data to conduct its calculations: the length of the rolling window, the number of bars projecting into the future, and a maximum of three sets of standard deviations.
Firstly, the rolling window. The algorithm amasses close prices from the number of bars determined by the value in the rolling window, aggregating them into an array. It then calculates their standard deviations in order to forecast the prospective minimum and maximum price values.
Subsequently, a loop is initiated running into the number of bars into the future, as dictated by the second parameter, to calculate the maximum price change in both the positive and negative direction.
The third parameter introduces a series of standard deviation values into the forecasting model, enabling users to dictate the volatility or confidence level of the results. A larger standard deviation correlates with a wider predicted range, thereby enhancing the probability factor.
APPLICATION
The purpose of the indicator is to provide traders with an understanding of the potential future movement of the price, demarcating maximum and minimum expected outcomes. For instance, if an asset demonstrates a substantial spike beyond the forecasted range, there's a significantly high probability of that price being rejected and reversed.
However, this indicator should not be the sole basis for your trading decisions. The range merely reflects the volatility within the rolling window and may overlook significant historical price movements. As with any trading strategies, synergize this with other indicators for a more comprehensive and reliable analysis.
Note: In instances where the number of predicted bars is exceedingly high, the lines may become scattered, presumably due to inherent limitations on the TradingView platform. Consequently, when applying three SD in your indicator, it is advised to limit the predicted bars to fewer than 80.
RISK DISCLAIMER
Trading entails substantial risk, and most day traders incur losses. All content, tools, scripts, articles, and education provided by TradeDots serve purely informational and educational purposes. Past performances are not definitive predictors of future results.
Script de código aberto
Em verdadeiro espírito do TradingView, o criador deste script o tornou de código aberto, para que os traders possam revisar e verificar sua funcionalidade. Parabéns ao autor! Embora você possa usá-lo gratuitamente, lembre-se de que a republicação do código está sujeita às nossas Regras da Casa.
Aviso legal
As informações e publicações não se destinam a ser, e não constituem, conselhos ou recomendações financeiras, de investimento, comerciais ou de outro tipo fornecidos ou endossados pela TradingView. Leia mais nos Termos de Uso.