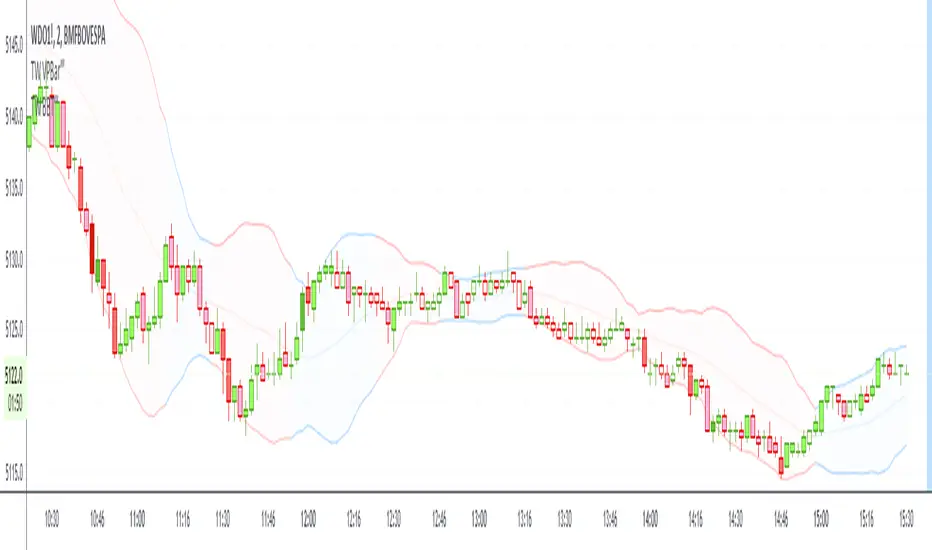
BBT‴ | Bollinger Band Trend Zone‴

Makes available to you the BB (Bollinger Bands) in a colored format and provies signal on the right side bar according to a Short, Mid or Long period.
If the candles are going out of the Bands too often, then use the Extended Bollinger Band atributes available to create an extra band around the original ones.
How does it work?
The BB drawing is the exact same as the ordinary one. The big deal here is that the BB shade can be represented by a Short, Mid or Long MA period (7, 20 or 55 period), that you want it to be presented in the shade, which is the same as the MA lines you regularly use. When the MA goes down you have a given color and when the MA goes up you have another given color. This way you don't need to keep looking the MA lines, just perceive the current shade color.
What's my filling?
Makes the quick perception very easy, just look to the chart.
Indicator attributes:
- BB shade color acording to trend
- BB band line colors acording to trend
- right side bar signals color acording to trend
- BB shade can be darker, just drop the box and choose the darker version of it
- Extended Bollinger Band to create an extra band around the original ones
To have access to this indicator, please DM me.
Don't contact me in the comment area.
1. the menu was reorganized with Titles
2. new Trend Zone called WaveEDGE is available to color the background Trend.
Hope you enjoy it!
Script sob convite
Somente usuários aprovados pelo autor podem acessar este script. Você precisará solicitar e obter permissão para usá-lo. Normalmente, essa permissão é concedida após o pagamento. Para obter mais detalhes, siga as instruções do autor abaixo ou entre em contato diretamente com MarceloTorres.
A TradingView NÃO recomenda pagar ou usar um script, a menos que você confie totalmente em seu autor e entenda como ele funciona. Você também pode encontrar alternativas gratuitas e de código aberto em nossos scripts da comunidade.
Instruções do autor
marcelo@tradewiser.pro
Vídeo-Análise completa diária no YouTube:
youtube.com/c/TradeWiserPro
Curso/AE
CursoAE.TradeWiser.pro
@TradeWiserPro
Telegram, Twitter, Facebook, LinkedIn, Instagram
Aviso legal
Script sob convite
Somente usuários aprovados pelo autor podem acessar este script. Você precisará solicitar e obter permissão para usá-lo. Normalmente, essa permissão é concedida após o pagamento. Para obter mais detalhes, siga as instruções do autor abaixo ou entre em contato diretamente com MarceloTorres.
A TradingView NÃO recomenda pagar ou usar um script, a menos que você confie totalmente em seu autor e entenda como ele funciona. Você também pode encontrar alternativas gratuitas e de código aberto em nossos scripts da comunidade.
Instruções do autor
marcelo@tradewiser.pro
Vídeo-Análise completa diária no YouTube:
youtube.com/c/TradeWiserPro
Curso/AE
CursoAE.TradeWiser.pro
@TradeWiserPro
Telegram, Twitter, Facebook, LinkedIn, Instagram