OPEN-SOURCE SCRIPT
Balance of Power [Pinescriptlabs]
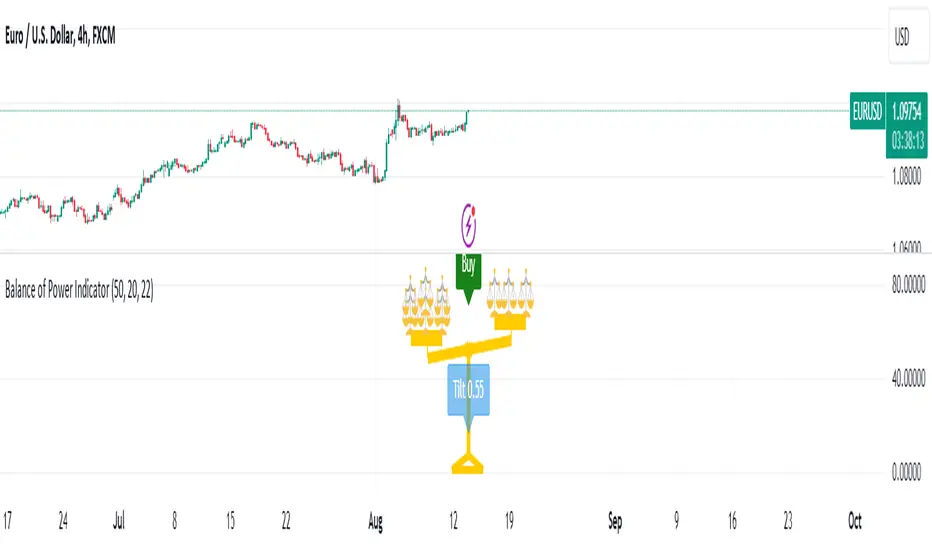
Balance of Power Indicator ⚖️
The Balance of Power Indicator is a visual tool that illustrates the power dynamics between buyers and sellers by analyzing recent price action. Instead of providing direct buy or sell signals, this indicator shows how the tilt of a symbolic scale reflects the relative strength of both parties. The calculation is based on the difference between the current closing price and the closing price from a specific number of periods (defined by the user), adjusted for market volatility measured by the ATR (Average True Range).
Tilt Value Interpretation:
• Positive Tilt (0 to 1) 📈:
o A tilt value close to 1 indicates significant control by buyers. The current price is well above the average adjusted for recent volatility. Practically, a tilt in the range of 0.50 to 1 suggests buyers are pushing the price above the average volatility, signaling a strong bullish trend.
•
o
• Negative Tilt (-1 to 0) 📉:
o A tilt value close to -1 indicates significant control by sellers. The current price has dropped notably compared to the average adjusted for recent volatility. A tilt in the range of -0.50 to -1 suggests sellers are dominating, with the price falling below the average volatility, reflecting a strong bearish trend.
o
Neutral:

Indicator Sensitivity:
The number of periods analyzed affects the sensitivity of the indicator:
• Shorter Periods: Make the indicator respond more quickly to price changes.
• Longer Periods: Smooth out the tilt, providing a more stable view of market forces.
Visualizing Relative Power:
The balance not only shows the general direction of power between buyers and sellers but also the intensity of this pressure. By adding more small balances, the indicator visually represents greater strength in the corresponding direction. Thus, the Balance of Power provides an overview of the balance between supply and demand, and allows for a visual assessment of the magnitude of that pressure based on the scale’s tilt.

Español
Indicador de Balance de Poder ⚖️
El Indicador de Balance de Poder es una herramienta visual que ilustra la dinámica de poder entre compradores y vendedores mediante el análisis de la acción reciente del precio. En lugar de proporcionar señales directas de compra o venta, este indicador muestra cómo la inclinación de una balanza simbólica refleja la fuerza relativa de ambas partes. El cálculo se basa en la diferencia entre el precio de cierre actual y el precio de cierre de un número específico de períodos (definidos por el usuario), ajustado por la volatilidad del mercado medida por el ATR (Average True Range).
#### **Interpretación del Valor de Tilt(inclinación):**
- Tilt Positivo (0 a 1) 📈:
- Un valor de inclinación cercano a **1** indica un control significativo por parte de los compradores. El precio actual está muy por encima del promedio ajustado por la volatilidad reciente. En términos prácticos, un tilt en el rango de **0.50 a 1** sugiere que los compradores están impulsando el precio por encima de la volatilidad promedio, señalando una fuerte tendencia alcista.
- **Tilt Negativo (-1 a 0) 📉:**
- Un valor de inclinación cercano a **-1** indica un control significativo por parte de los vendedores. El precio actual ha caído notablemente en comparación con el promedio ajustado por la volatilidad reciente. Un tilt en el rango de **-0.50 a -1** sugiere que los vendedores están dominando, con el precio cayendo por debajo de la volatilidad promedio, reflejando una fuerte tendencia bajista.
- **Neutral:**
**Sensibilidad del Indicador:**
El número de períodos analizados afecta la sensibilidad del indicador:
- **Períodos más cortos:** Hacen que el indicador responda más rápidamente a los cambios en el precio.
- **Períodos más largos:** Suavizan la inclinación, proporcionando una visión más estable de las fuerzas del mercado.
#### **Visualización del Poder Relativo:**
La balanza no solo muestra la dirección general del poder entre compradores y vendedores, sino también la intensidad de esta presión. Al agregar más pequeñas balanzas, el indicador representa visualmente una mayor fuerza en la dirección correspondiente. Así, el **Balance de Poder** proporciona una visión general del equilibrio entre oferta y demanda y permite una evaluación visual de la magnitud de esa presión basada en la inclinación de la balanza.
The Balance of Power Indicator is a visual tool that illustrates the power dynamics between buyers and sellers by analyzing recent price action. Instead of providing direct buy or sell signals, this indicator shows how the tilt of a symbolic scale reflects the relative strength of both parties. The calculation is based on the difference between the current closing price and the closing price from a specific number of periods (defined by the user), adjusted for market volatility measured by the ATR (Average True Range).
Tilt Value Interpretation:
• Positive Tilt (0 to 1) 📈:
o A tilt value close to 1 indicates significant control by buyers. The current price is well above the average adjusted for recent volatility. Practically, a tilt in the range of 0.50 to 1 suggests buyers are pushing the price above the average volatility, signaling a strong bullish trend.
•
o
• Negative Tilt (-1 to 0) 📉:
o A tilt value close to -1 indicates significant control by sellers. The current price has dropped notably compared to the average adjusted for recent volatility. A tilt in the range of -0.50 to -1 suggests sellers are dominating, with the price falling below the average volatility, reflecting a strong bearish trend.
o
Neutral:
Indicator Sensitivity:
The number of periods analyzed affects the sensitivity of the indicator:
• Shorter Periods: Make the indicator respond more quickly to price changes.
• Longer Periods: Smooth out the tilt, providing a more stable view of market forces.
Visualizing Relative Power:
The balance not only shows the general direction of power between buyers and sellers but also the intensity of this pressure. By adding more small balances, the indicator visually represents greater strength in the corresponding direction. Thus, the Balance of Power provides an overview of the balance between supply and demand, and allows for a visual assessment of the magnitude of that pressure based on the scale’s tilt.
Español
Indicador de Balance de Poder ⚖️
El Indicador de Balance de Poder es una herramienta visual que ilustra la dinámica de poder entre compradores y vendedores mediante el análisis de la acción reciente del precio. En lugar de proporcionar señales directas de compra o venta, este indicador muestra cómo la inclinación de una balanza simbólica refleja la fuerza relativa de ambas partes. El cálculo se basa en la diferencia entre el precio de cierre actual y el precio de cierre de un número específico de períodos (definidos por el usuario), ajustado por la volatilidad del mercado medida por el ATR (Average True Range).
#### **Interpretación del Valor de Tilt(inclinación):**
- Tilt Positivo (0 a 1) 📈:
- Un valor de inclinación cercano a **1** indica un control significativo por parte de los compradores. El precio actual está muy por encima del promedio ajustado por la volatilidad reciente. En términos prácticos, un tilt en el rango de **0.50 a 1** sugiere que los compradores están impulsando el precio por encima de la volatilidad promedio, señalando una fuerte tendencia alcista.
- **Tilt Negativo (-1 a 0) 📉:**
- Un valor de inclinación cercano a **-1** indica un control significativo por parte de los vendedores. El precio actual ha caído notablemente en comparación con el promedio ajustado por la volatilidad reciente. Un tilt en el rango de **-0.50 a -1** sugiere que los vendedores están dominando, con el precio cayendo por debajo de la volatilidad promedio, reflejando una fuerte tendencia bajista.
- **Neutral:**
**Sensibilidad del Indicador:**
El número de períodos analizados afecta la sensibilidad del indicador:
- **Períodos más cortos:** Hacen que el indicador responda más rápidamente a los cambios en el precio.
- **Períodos más largos:** Suavizan la inclinación, proporcionando una visión más estable de las fuerzas del mercado.
#### **Visualización del Poder Relativo:**
La balanza no solo muestra la dirección general del poder entre compradores y vendedores, sino también la intensidad de esta presión. Al agregar más pequeñas balanzas, el indicador representa visualmente una mayor fuerza en la dirección correspondiente. Así, el **Balance de Poder** proporciona una visión general del equilibrio entre oferta y demanda y permite una evaluación visual de la magnitud de esa presión basada en la inclinación de la balanza.
Script de código aberto
Em verdadeiro espírito do TradingView, o criador deste script o tornou de código aberto, para que os traders possam revisar e verificar sua funcionalidade. Parabéns ao autor! Embora você possa usá-lo gratuitamente, lembre-se de que a republicação do código está sujeita às nossas Regras da Casa.
Aviso legal
As informações e publicações não se destinam a ser, e não constituem, conselhos ou recomendações financeiras, de investimento, comerciais ou de outro tipo fornecidos ou endossados pela TradingView. Leia mais nos Termos de Uso.