OPEN-SOURCE SCRIPT
ATR Regime Filter (median & P70)
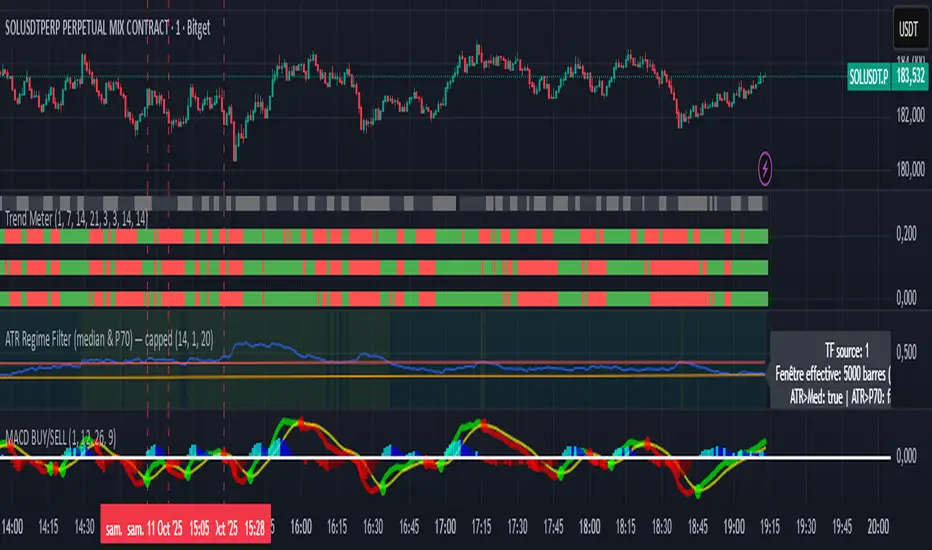
ATR Regime Filter (Median & P70)
Purpose
Filter your signals by the volatility regime. The indicator compares the current ATR to two rolling statistical thresholds—the median (P50) and the 70th percentile (P70)—to avoid trading during quiet phases and prioritize setups when the market “breathes.”
How it works
Computes ATR(14) on a user-defined source timeframe (srcTF) via request.security.
Converts a target window in days (days) into bars of the source TF.
Due to Pine limits, the effective window is capped at 5000 bars (shown in an optional label).
Calculates Median (P50) and P70 of ATR over the effective window.
Exposes two booleans:
ATR > Median (normal-to-elevated volatility)
ATR > P70 (elevated volatility)
Display
Plots: ATR, Median, P70.
Panel background (bgcolor):
light green when ATR > P70
teal when ATR > Median
neutral otherwise
Optional label: shows source TF, effective window size (bars & days), and the boolean states.
Inputs
ATR length (default 14)
TF source ATR (srcTF, e.g., “1”, “5”, “15”)
Target window (days) (days, default 20)
Show label (bool)
Suggested use
Breakout/Momentum: require ATR > P70 in addition to your breakout conditions (close beyond level, volume, retest).
Range/Mean reversion: at minimum require ATR > Median.
In strategies, use ATR > Median/P70 as a filter alongside price structure, volume, and EMAs.
Limitations
On very short source TFs (e.g., 1-min), the window may be clipped to 5000 bars (~3.5 days). Increase srcTF (5m/15m) if you want a true 15–30 day history.
ATR measures magnitude, not direction—combine with trend/structure signals.
Script de código aberto
Em verdadeiro espírito do TradingView, o criador deste script o tornou de código aberto, para que os traders possam revisar e verificar sua funcionalidade. Parabéns ao autor! Embora você possa usá-lo gratuitamente, lembre-se de que a republicação do código está sujeita às nossas Regras da Casa.
Aviso legal
As informações e publicações não se destinam a ser, e não constituem, conselhos ou recomendações financeiras, de investimento, comerciais ou de outro tipo fornecidos ou endossados pela TradingView. Leia mais nos Termos de Uso.