OPEN-SOURCE SCRIPT
Atualizado Multi-Timeframe Trend Table
📊 Multi-Timeframe Trend Table
Overview
This powerful trend-tracking tool gives you a real-time snapshot of market trends across multiple timeframes — all in one compact and color-coded table. Designed for traders who want fast, clean, and multi-timeframe awareness at a glance.
⸻
✅ Features
• 7 Key Timeframes Monitored:
2min · 5min · 15min · 1h · 4h · 1d · 1w
• Trend Detection Based on EMAs
Uses a fast (default 20) and slow (default 200) EMA to determine if a timeframe is trending:
• 🟢 Uptrend: Fast EMA is above slow EMA
• 🔴 Downtrend: Slow EMA is above fast EMA
• 🟠 Sideways: EMAs are close (configurable threshold)
• Raw EMA Distance
See the actual difference between fast and slow EMAs for each timeframe — great for gauging trend strength.
• EMA Slope Analysis
A unique “Slope” column tells you the current behavior of EMAs:
• 📈 Pointing Up
• 📉 Pointing Down
• 🔄 Crossing Up/Down
• ➡️ Lateral
• Instant Alerts
Alerts fire the moment a trend flips on any timeframe, keeping you ahead of market shifts.
• Optional Chart EMAs
Toggle on/off the fast and slow EMAs on your active chart for extra clarity.
⸻
🧠 Use Case Examples
• Confirm trades with alignment across multiple timeframes
• Spot early trend reversals with crossing behavior
• Add a higher-timeframe filter to your scalping system
• Monitor key EMAs without changing your chart timeframe
⸻
⚙️ Configuration
• EMA lengths and sideways threshold are fully adjustable
• Enable/disable chart overlays for EMAs
• Table dynamically updates in real time
⸻
💡 Pro Tip: Use this indicator alongside your entry strategy to only trade in the direction of the dominant trends.
⸻
Notas de Lançamento
📊 Multi-Timeframe Trend Table (MTFTT)Overview:
This indicator gives you a complete multi-timeframe trend overview using Fast and Slow EMAs, Stochastic Oscillator, and EMA slope analysis. It helps identify trend direction, strength, and alignment conditions across multiple timeframes in a clean and compact table format.
⸻
🧠 How it Works:
• Trend is determined by whether Fast EMA is above/below Slow EMA and both are sloping in the same direction.
• Diff reflects how far apart the EMAs are:
• Crossed: very close (less than 0.1%)
• Close: small gap (0.1% to 1%)
• Far: strong separation (over 1%)
• Stochastic confirms momentum—helps filter out bad entries.
• Alignment checks if price, trend, and momentum are all moving in the same direction.
• Bias gives a quick snapshot of where the price sits in relation to both EMAs.
⸻
🛠️ Settings:
• EMA Lengths (Fast & Slow)
• Stochastic settings
• Sideways threshold for detecting flat trends
• Toggle EMA visibility
• Fullscreen table mode
⸻
🧪 Use Cases:
• Confirm multi-timeframe trend alignment before entries
• Identify trend strength (using EMA slope and distance)
• Detect reversals or sideways markets early
• Pair with other entry signals or breakout strategies
Notas de Lançamento
📊 Multi-Timeframe Trend Table — Pro EditionOverview:
A powerful multi-timeframe trend dashboard that combines EMA alignment, stochastic signals, MA proximity, and momentum strength into a compact, customizable table. Ideal for traders looking to identify high-confluence entry zones across intraday and higher timeframes.
⸻
🧩 Table Columns:
• TF – Timeframe
• Trend – EMA-based trend (↑ Bullish, ↓ Bearish, → Sideways)
• MA Distance – Price distance from Fast EMA (in ATR) with t-shirt size label (XS to XL)
• Stoch – Stochastic oscillator value (%)
• MA Slope – Slope direction of the Fast EMA
• Align – ✔ if trend, price, stoch (and optionally MA Distance) all align
• Price Bias – Whether price is above or below both EMAs (Bullish/Bearish/Neutral)
• Strength – Trend momentum based on slope steepness (↟ Strong, ↑ Up, → Sideways, etc.)
⸻
⚙️ Customizable Parameters:
• Fast/Slow EMA lengths
• Stochastic thresholds
• MA Distance thresholds for XS/S/M/L/XL
• Toggle to require MA Distance proximity for Align
• Full-screen table mode
• Momentum strength visualization
⸻
🧠 Use Cases:
• Identify timeframes where price is near EMAs and trend is aligned
• Avoid chasing extended trends by filtering out distant MA entries
• Spot momentum shifts across multiple timeframes
• Build confident entries where ✔ Align + Strong trend agree
Notas de Lançamento
🧠 Multi-Timeframe Trend TableThis script gives you a full dashboard of market conditions across key timeframes — from 2 minutes to 1 week — using visual cues and calculated insights. It’s designed for traders who want confirmation from multiple timeframes before making a move.
⸻
📊 📋 Table Columns Explained:
1. TF (Timeframe)
Displays the timeframe being analyzed (e.g., 2m, 5m, 1H, etc.).
⸻
2. Trend
🔼 Uptrend if Fast EMA > Slow EMA
🔽 Downtrend if Fast EMA < Slow EMA
➡️ Sideways if Fast and Slow EMAs are close together (within your set % threshold)
⸻
3. MA Distance (T-Shirt Size)
Measures how far the price is from the Fast EMA, using the ATR (Average True Range) as a volatility gauge:
• ⚪ XS = Very close to EMA
• 🟢 S = Slightly off
• 🟡 M = Moderate distance
• 🟠 L = Far
• 🔴 XL = Very far
Only shown if price is trending and in the same direction (above EMA for uptrend, below for downtrend).
⸻
4. Stoch
Stochastic oscillator value (0–100) to show momentum.
• 🔴 Red if overbought
• 🟢 Green if oversold
• ⚪ White if neutral
⸻
5. MA Slope
Direction the Fast EMA is moving:
• ↑ = Slope rising
• ↓ = Slope falling
• → = Flat slope
⸻
6. Align
✅ Shows a ✔ if everything is aligned for a clean entry:
• Trend direction is clear
• Price is above/below both EMAs in the trend direction
• Stoch is favorable (not overbought for longs / not oversold for shorts)
• MA Distance is close (XS/S/M), if enabled in settings
⸻
7. Price Bias
Estimates price positioning:
• Bullish = Price is above both EMAs
• Bearish = Price is below both EMAs
• Neutral = Mixed
⸻
8. Strength
Based on Fast EMA’s slope strength:
• ↟ Strong = Strong up slope
• ↑ Up = Gentle up slope
• ↡ Strong = Strong down slope
• ↓ Down = Gentle down slope
• → Sideways = No clear slope
⸻
🛠️ Customizable Settings (with Default Values and Suggestions)
• Fast EMA Length
Default: 20
Defines the short-term trend line. A lower value makes the EMA more sensitive.
• ✅ Day Trading Suggestion: 8 to 21
• ✅ Swing Trading Suggestion: 20 to 50
• Slow EMA Length
Default: 200
Defines the long-term trend line. Used to determine trend direction by comparing it to the fast EMA.
• ✅ Day Trading Suggestion: 50 to 100
• ✅ Swing Trading Suggestion: 100 to 200
• Sideways EMA % Difference
Default: 0.1
If the fast and slow EMAs are within this percentage difference, the trend is considered sideways.
• ✅ Day Trading Suggestion: 0.1 to 0.2
• ✅ Swing Trading Suggestion: 0.05 to 0.15
• Show EMAs on Chart
Default: false
When enabled, it visually plots the fast and slow EMAs directly on the price chart.
• ✅ Day Trading: true (to see fast reactions)
• ✅ Swing Trading: optional
• Full Screen Table Mode
Default: false
When true, centers the trend table on screen in a larger format.
• ✅ Day Trading: false (compact view is cleaner)
• ✅ Swing Trading: true (dashboard layout)
• Only Align if MA Distance is XS/S/M
Default: true
Filters out signals where price is too far from the EMA. Helps avoid overextended entries.
• ✅ Day Trading: true
• ✅ Swing Trading: true
• Stochastic Length
Default: 8
Defines how many candles to calculate the stochastic. Lower values make it more sensitive.
• ✅ Day Trading: 5 to 14
• ✅ Swing Trading: 8 to 14
• Stoch Overbought
Default: 70.0
Marks the overbought zone for the stochastic oscillator.
• ✅ Day Trading: 70 to 80
• ✅ Swing Trading: 70
• Stoch Oversold
Default: 30.0
Marks the oversold zone for the stochastic oscillator.
• ✅ Day Trading: 20 to 30
• ✅ Swing Trading: 30
• MA Distance Thresholds (ATR Multiples)
These values define how far price is from the fast EMA, scaled by the ATR. They’re used to label distance with XS/S/M/L/XL:
• XS Threshold
Default: 0.25
✅ Day Trading: 0.2 to 0.4
✅ Swing Trading: 0.1 to 0.3
• S Threshold
Default: 0.75
✅ Day Trading: 0.5 to 1.0
✅ Swing Trading: 0.4 to 0.8
• M Threshold
Default: 1.5
✅ Day Trading: 1.0 to 2.0
✅ Swing Trading: 1.0 to 1.5
• L Threshold
Default: 2.5
✅ Day Trading: 2.0 to 3.0
✅ Swing Trading: 2.0 to 2.5
⸻
✅ Ideal For:
Trend-following, scalping, swing trading — especially when you want multi-timeframe confirmation before entering a trade.
Notas de Lançamento
📊 Multi-Timeframe Trend TableA compact yet powerful tool for analyzing trend conditions across multiple timeframes. This table helps traders quickly assess alignment across EMAs, price structure, momentum, and volatility.
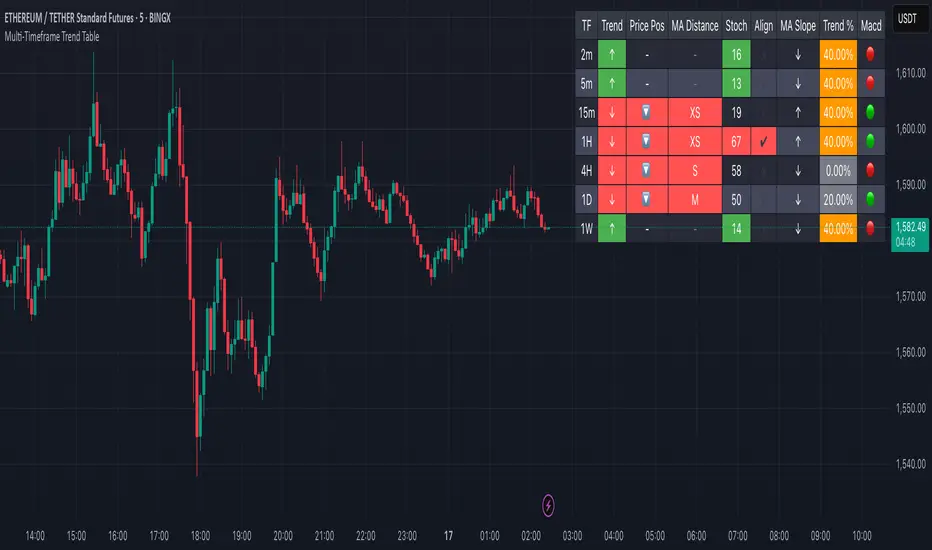
🧠 Columns Explained:
1. TF – Timeframe label for each row (e.g., 2m, 15m, 1D).
2. Trend – Determined by EMA crossover:
• ↑ if Fast EMA (20) > Slow EMA (200) → bullish (green)
• ↓ if Fast EMA < Slow EMA → bearish (red)
• → if nearly equal → sideways (orange)
3. Price Pos – Where price sits relative to both EMAs:
• 🔼 above both
• 🔽 below both
• – between
Background color reflects agreement with the trend.
4. MA Distance – Distance from price to the Fast EMA using ATR multiples:
• XS, S, M, L, XL
Green/red background if aligned with trend and distance is close enough. Text turns white when highlighted.
5. Stoch – Rounded Stochastic %K value:
• Green background if oversold during a bullish trend
• Red background if overbought during a bearish trend
6. Align – ✅ when all alignment conditions are met:
• Trend direction matches price position
• Stochastic not overextended
• MA distance is XS/S/M
Shows ❌ with a custom tooltip when not aligned, explaining which conditions are missing.
7. MA Slope – Direction of the Fast EMA over the last 5 bars:
• ↑ Rising
• ↓ Falling
• → Flat
8. Trend % – Composite trend strength score (0–100%), based on:
• EMA crossover
• Slope direction
• MACD signal
• Price position
• Higher timeframe trend
9. Macd – MACD condition:
• 🟢 MACD line above Signal
• 🔴 MACD line below Signal
Script de código aberto
Em verdadeiro espírito do TradingView, o criador deste script o tornou de código aberto, para que os traders possam revisar e verificar sua funcionalidade. Parabéns ao autor! Embora você possa usá-lo gratuitamente, lembre-se de que a republicação do código está sujeita às nossas Regras da Casa.
Aviso legal
As informações e publicações não se destinam a ser, e não constituem, conselhos ou recomendações financeiras, de investimento, comerciais ou de outro tipo fornecidos ou endossados pela TradingView. Leia mais nos Termos de Uso.