PROTECTED SOURCE SCRIPT
Atualizado Multi Time Frame RSI [Horizonn Wealth]
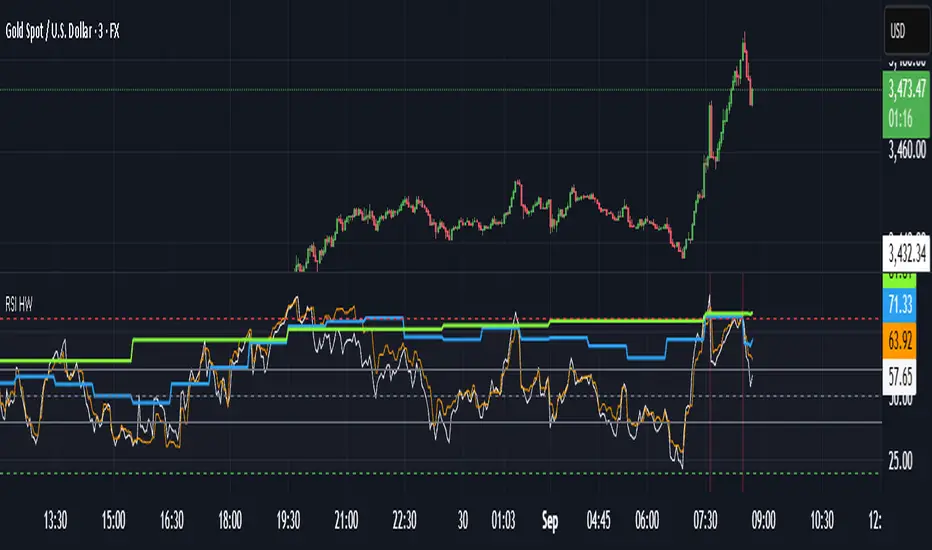
Multi-Time Frame Analysis: A key feature is the ability to choose a time frame for each of the four RSI lines from a predefined list (Chart, 1 day, 1 week, 1 month). The script uses the request.security() function with lookahead enabled to ensure the most accurate, real-time data is used for each calculation, eliminating look-ahead bias and calculation errors.
Visual Levels: The indicator plots standard RSI levels at 30, 50, and 70, with a shaded background between the oversold (30) and overbought (70) zones to provide a clear visual reference.
Momentum Alignment Signals: The script includes an optional feature that highlights the chart's background with a red or green color when all four RSIs simultaneously enter an overbought or oversold state. This serves as an immediate visual alert for a strong, multi-time frame momentum condition.
This indicator is a robust tool for technical analysis, suitable for traders who use a top-down approach to their market analysis.
Notas de Lançamento
Multi-Time Frame Analysis: A key feature is the ability to choose a time frame for each of the four RSI lines from a predefined list (Chart, 1 day, 1 week, 1 month). The script uses the request.security() function with lookahead enabled to ensure the most accurate, real-time data is used for each calculation, eliminating look-ahead bias and calculation errors.Visual Levels: The indicator plots standard RSI levels at 30, 50, and 70, with a shaded background between the oversold (30) and overbought (70) zones to provide a clear visual reference.
Momentum Alignment Signals: The script includes an optional feature that highlights the chart's background with a red or green color when all four RSIs simultaneously enter an overbought or oversold state. This serves as an immediate visual alert for a strong, multi-time frame momentum condition.
This indicator is a robust tool for technical analysis, suitable for traders who use a top-down approach to their market analysis.
Script protegido
Esse script é publicada como código fechado. No entanto, você pode gerenciar suas escolhas de bate-papo. Por favor, abra suas Configurações do perfil
Aviso legal
As informações e publicações não se destinam a ser, e não constituem, conselhos ou recomendações financeiras, de investimento, comerciais ou de outro tipo fornecidos ou endossados pela TradingView. Leia mais nos Termos de Uso.