OPEN-SOURCE SCRIPT
M-Oscillator
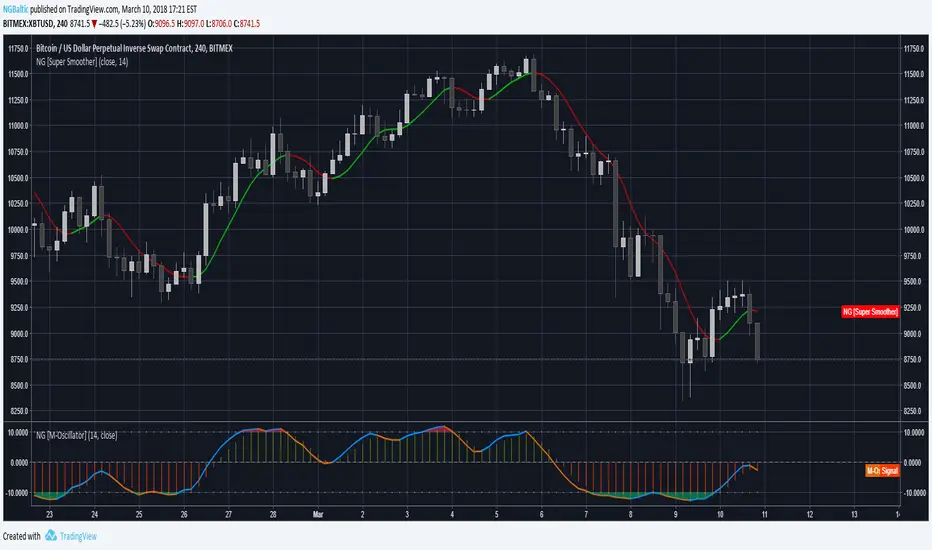
The M-Oscillator is a bounded oscillator that moves between (-14) and (+14), it gives early buy/sell signals, spots divergences, displays overbought/oversold levels, and provides re-entry points, and it also work as a trend identifier.
Interpretation
• M-Oscillator is plotted along the bottom of the price chart; it fluctuates between positive and negative 14.
• Movement above 10 is considered overbought, and movement below -10 is oversold.
• In sharp moves to the upside, the M-Oscillator fluctuates between 5 and 14, while in down side it fluctuates between -5 and -14.
• In an uptrend, the M-Oscillator fluctuates between zero and 14 and vice versa.
Trading tactics
Overbought/Oversold: We define the overbought area as anywhere above the 10 level.
The oversold area is below -10. When the M-Oscillator goes above 10 (overbought) and then re-crosses it to the downside, a sell signal is triggered.
When the M-Oscillator surpasses -10 to the downside and then re-crosses back above this level, a buy signal is triggered.
This tactic is only successful during sideways markets; during an uptrend, the oscillator will remain in its overbought territory for long period of times.
During a downtrend, it will remain in oversold for a long time.
Divergence
Divergence is one of the most striking features of the M-Oscillator.
It is a very important aspect of technical analysis that enhances trading tactics enormously; it shows hidden weakness or strength in the market, which is not apparent in the price action.
A positive divergence occurs when the price is declining and makes a lower low, while M-Oscillator witnesses a higher low.
A negative divergence occurs when the price is rising and makes a higher High, while the M-Oscillator makes a lower high, which indicates hidden weakness in the market.
Divergences are very important as they give us early hints of trend reversal (weekly chart)
Script de código aberto
Em verdadeiro espírito do TradingView, o criador deste script o tornou de código aberto, para que os traders possam revisar e verificar sua funcionalidade. Parabéns ao autor! Embora você possa usá-lo gratuitamente, lembre-se de que a republicação do código está sujeita às nossas Regras da Casa.
Aviso legal
As informações e publicações não se destinam a ser, e não constituem, conselhos ou recomendações financeiras, de investimento, comerciais ou de outro tipo fornecidos ou endossados pela TradingView. Leia mais nos Termos de Uso.