OPEN-SOURCE SCRIPT
Atualizado Range Percentage
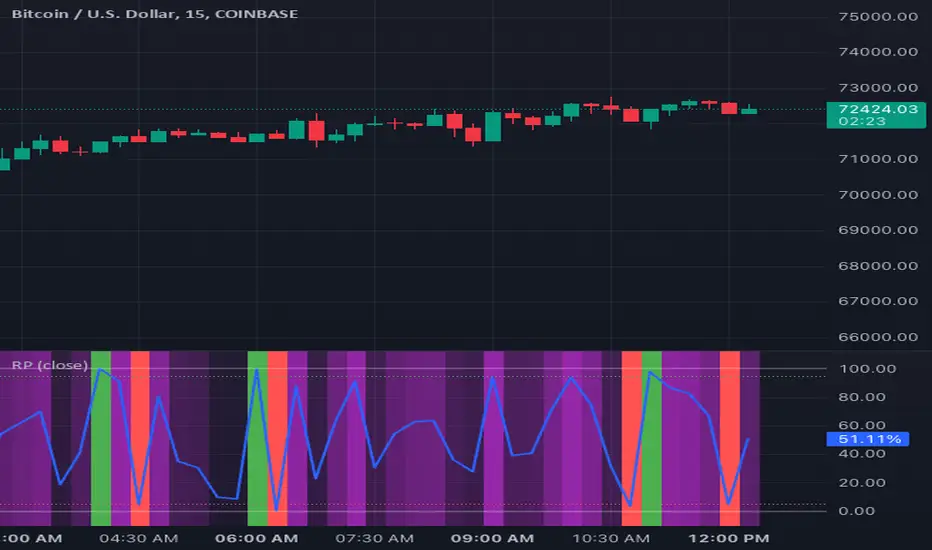
Range Percentage is a simple indicator utility to clearly display and dynamically alert on where a chosen series falls between two bounds, either series themselves or constant values.
To set up, select between series or value for upper and lower bounds. Only the chosen options will be used by the indicator, though you may enter the non-selected option. Configure the thresholds if you wish to use them for visual display or alerting. If you only care about the background color, disable both thresholds and the percentage line and move the indicator into the main pane.
Some sample use cases:
This indicator is often most useful in conjunction with other indicators which produce a plotted series output and can save a lot of time thinking or interpreting. Its usefulness to a trader depends entirely on the rationale for choosing a lower/upper bound and sample series that are meaningful to that trader.
To set up, select between series or value for upper and lower bounds. Only the chosen options will be used by the indicator, though you may enter the non-selected option. Configure the thresholds if you wish to use them for visual display or alerting. If you only care about the background color, disable both thresholds and the percentage line and move the indicator into the main pane.
Some sample use cases:
- Coloring background on a zoomed-in chart to show to show price change relative to the entire value of an asset, not just the range selected on the y-axis
- Get alerts which adjust dynamically as price approaches another series or dynamic value
- Determine at a glance where a price falls between your identified support/resistance lines, no matter where you zoom or scroll
- Compare relative gain of two assets
- Identify trends of a price closing closer to low or high over time
This indicator is often most useful in conjunction with other indicators which produce a plotted series output and can save a lot of time thinking or interpreting. Its usefulness to a trader depends entirely on the rationale for choosing a lower/upper bound and sample series that are meaningful to that trader.
Notas de Lançamento
Range Percentage is a simple indicator utility to clearly display and dynamically alert on where a chosen series falls between two bounds, either series themselves or constant values.To set up, select between series or value for upper and lower bounds. Only the chosen options will be used by the indicator, though you may enter the non-selected option. Configure the thresholds if you wish to use them for visual display or alerting. If you only care about the background color, disable both thresholds and the percentage line and move the indicator into the main pane.
Some sample use cases:
- Coloring background on a zoomed-in chart to show to show price change relative to the entire value of an asset, not just the range selected on the y-axis
- Get alerts which adjust dynamically as price approaches another series or dynamic value
- Determine at a glance where a price falls between your identified support/resistance lines, no matter where you zoom or scroll
- Compare relative gain of two assets
- Identify trends of a price closing closer to low or high over time
This indicator is often most useful in conjunction with other indicators which produce a plotted series output and can save a lot of time thinking or interpreting. Its usefulness to a trader depends entirely on the rationale for choosing a lower/upper bound and sample series that are meaningful to that trader.
Changelog
March 11, 2024 - Initial release
March 19, 2024 - Added multi timeframe support
Script de código aberto
Em verdadeiro espírito do TradingView, o criador deste script o tornou de código aberto, para que os traders possam revisar e verificar sua funcionalidade. Parabéns ao autor! Embora você possa usá-lo gratuitamente, lembre-se de que a republicação do código está sujeita às nossas Regras da Casa.
Aviso legal
As informações e publicações não se destinam a ser, e não constituem, conselhos ou recomendações financeiras, de investimento, comerciais ou de outro tipo fornecidos ou endossados pela TradingView. Leia mais nos Termos de Uso.