OPEN-SOURCE SCRIPT
Azmi Moving Averages
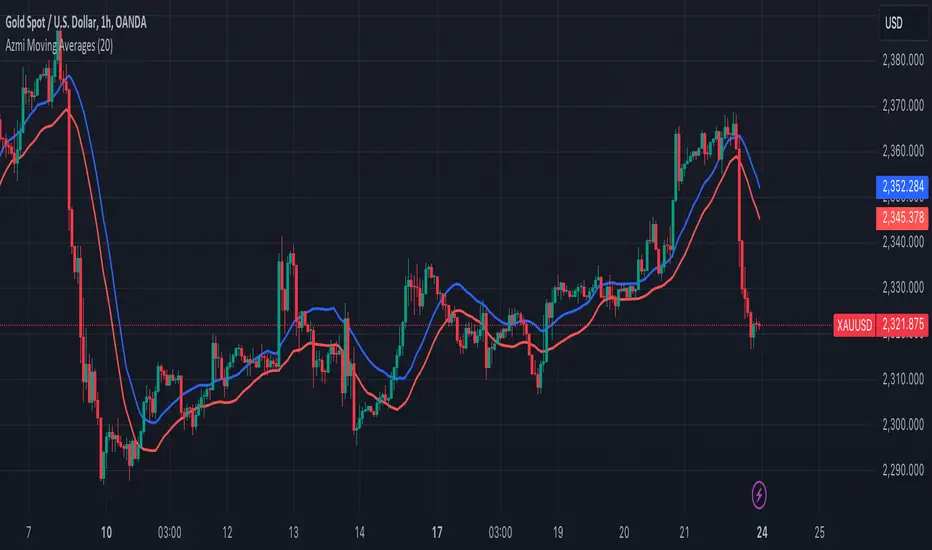
This trading indicator, designed using Pine Script, incorporates two simple moving averages (SMAs) with the same length but different data sources. Here's a detailed description of the indicator:
### Indicator Overview
**Name:** Two Moving Averages
### Inputs
1. **Length (20):** The period over which the moving averages are calculated. Both moving averages use a length of 20 periods.
2. **Source:**
- **High:** The first moving average is calculated using the high prices of the candles.
- **Low:** The second moving average is calculated using the low prices of the candles.
### Calculations
1. **MA High (maHigh):** This is the simple moving average of the high prices over the specified length (20 periods). It smooths the high prices over time, showing the average high price trend.
2. **MA Low (maLow):** This is the simple moving average of the low prices over the same length (20 periods). It smooths the low prices over time, showing the average low price trend.
### Plotting
- **MA High (Blue Line):** This line represents the moving average of the high prices. It is plotted in blue with a line width of 2.
- **MA Low (Red Line):** This line represents the moving average of the low prices. It is plotted in red with a line width of 2.
### Interpretation
1. **Trend Identification:**
- **Bullish Trend:** When the MA High is above the MA Low, it generally indicates a bullish trend, as the average high prices are higher than the average low prices.
- **Bearish Trend:** When the MA High is below the MA Low, it suggests a bearish trend, as the average high prices are lower than the average low prices.
2. **Support and Resistance:**
- The MA High can act as a dynamic resistance level, where the price may face selling pressure.
- The MA Low can act as a dynamic support level, where the price may find buying interest.
3. **Price Channels:**
- The area between the MA High and MA Low creates a channel that can help traders visualize the range within which the price is fluctuating. This channel can be used to identify potential breakout or breakdown points.
### Example Usage
- **Buy Signal:** A potential buy signal may occur when the price crosses above both the MA High and MA Low, indicating a possible upward trend.
- **Sell Signal:** A potential sell signal may occur when the price crosses below both the MA High and MA Low, indicating a possible downward trend.
This indicator provides a visual representation of the average high and low prices, helping traders identify trends, potential support and resistance levels, and price channels for better trading decisions.
Script de código aberto
Em verdadeiro espírito do TradingView, o criador deste script o tornou de código aberto, para que os traders possam revisar e verificar sua funcionalidade. Parabéns ao autor! Embora você possa usá-lo gratuitamente, lembre-se de que a republicação do código está sujeita às nossas Regras da Casa.
Aviso legal
As informações e publicações não se destinam a ser, e não constituem, conselhos ou recomendações financeiras, de investimento, comerciais ou de outro tipo fornecidos ou endossados pela TradingView. Leia mais nos Termos de Uso.