Clear divergence on Bitcoin daily ChartValue candle show a clear divergence on the daily BTCUSD pointing to relevant correction after the recent stretch in price hikes. Might be just a temporary (healthy) correction before greater hikes, but reports of whales moving big volumes out of the exchanges are not so exciting for the bulls.
Pequisar nas ideias por "divergence"


Divergence RSI indicate a possible shortas we can see in the graph there is a divergence between the bullish movement and the RSI indicator, which tells us that the bulls are tired and may have a short-term retraction up to support level 1.673.
If this level exceeds this level we can see the continuity of the low trend.
conforme nós podemos observar no grafico ha divergencia entre o movimento de alta e o indicador RSI, o que nos diz que os touros estão cansados e poderemos ter uma retração de curto prazo até o niveil de suporte 1.673.
Caso ultrapasse esse nivel poderemos ver a continuidade da tendencia de baixa

Bearish Divergences RSIBearish divergences in the RSI indicate a correction of around 15%, seeking to test the previous top near $30,500.
It would also be a 0.618 Fibonacci zone on the daily chart since the rally that began on October 15th.

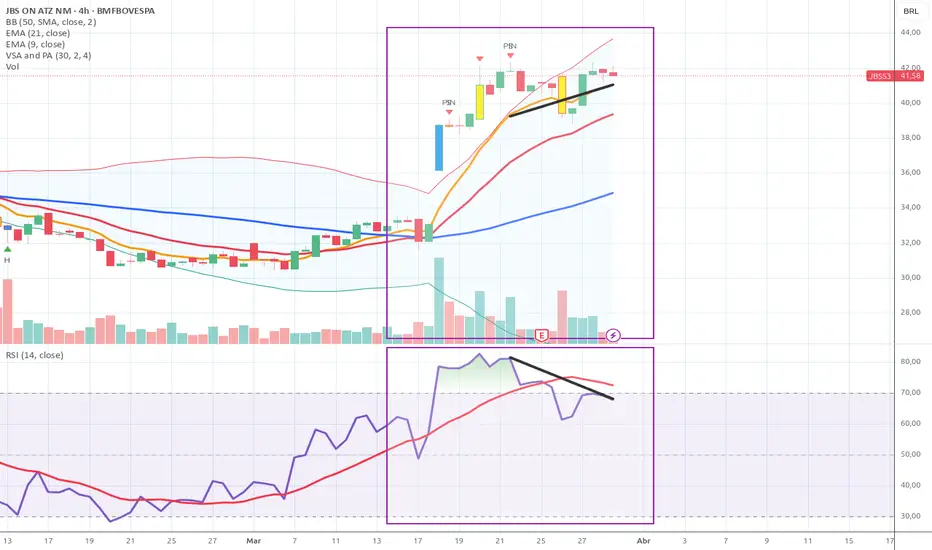
Is JBSS3 with RSI divergence on the 4-hour chart ?Is JBSS3 with RSI divergence on the 4-hour chart ?
If so, we have a reversal signal.
SUZB3 with RSI divergence on the daily chartSUZB3 with RSI divergence on the daily chart.
Multiple trend reversal signals within an uptrend channel.

(M) Sinais de divergência de alta (bullish hidden divergence)FX_IDC:USDBRL
Temos dois canais aos quais devemos dar alguma atenção:
1- Um que se vem formando desde os anos 90', um canal ascendente, que é esclarecedor em relação à tendência de longo prazo, que está agora a ser ameaçado (ou reforçado) após a formação do fractal nos 5.99 - a forçar novo período de consolidação;
2- Uma "bullish flag" - bandeira de alta - mais recentemente formada num canal paralelo descendente entre os máximos formados nos 5.99 em Maio de 2020 e o suporte formado nos 4.58 em Abril deste ano.
Nota educacional: O eventual falso rompimento da resistência de um canal, pode ser seguido de um teste ao suporte do mesmo - independentemente do "timeframe" em que é formado;
Aplicando a teoria a este caso, o falso rompimento do canal ascendente, pode forçar o teste ao suporte do mesmo, o que implica uma queda aos 3.00 / 2.50. No entanto, só poderemos confirmar o falso rompimento do canal, após a recuperação da resistência anterior posicionada nos 4.24, pelo qual teremos de aguardar pacientemente.
Mais movimento de alta?
Com o suporte formado nos 4.58 "alimentado" pela divergência de alta escondida (bullish hidden divergence) a sugerir mais movimento a favor da tendência, temos de estar atentos ao potencial rompimento do fractal formado nos 5.99, que pode desencadear um movimento em direção aos níveis de Fibonacci projetados acima dos 6.48, com especial atenção à extensão projetada nos 7.21 - a extensão de 224% - e a eventual formação de um padrão de baixa - que pode forçar nova retração após concluído.
Posto isto, espero mais movimento de alta após o rompimento do padrão "bullish flag", e apenas uma queda abaixo dos 4.24 fará soar os alarmes para uma eventual alteração na tendência.

Bitcoin will pump now, has bullish divergence Bitcoin has bullish divergence on the high time frame, and will pump now!

ETHUSDT Ready for some correction big HUGE Negative DivergenceETHUSDT Ready for some correction big HUGE Negative Divergence, with the dollar forming a Inverted H&S and breaking out the downtrend channel i expected very soon a good correction , for later return to big up swings, good trades to everyone's ! Stay SAFE !

ETHUSDT Ready for some correction big HUGE Negative DivergenceETHUSDT Ready for some correction big HUGE Negative Divergence, with the dollar forming a Inverted H&S and breaking out the donwtrend channel i expected very soon a good correction , for later return to big up swings, good trades to everyones ! Stay SAFE !

Bullish Divergence will break the accumulation Samme pattern from days ago, indicator going up and prices going down, them the pump .. the accumulation time now is very important to break the 10k psycho resistance.
Daily and Weakly charts indicate a double bottom top pattern , this bullish divergence could be the second leg, with some accumulation beferore trying 11k
if EMA 80 and EMA8 still bullish this could be the road to 11k
<3


Divergence lay outIndicadores que retiram a tendência do preço, são perefitos para análise de divergência.
Um dia ainda publico esses indicadores ;)

Crossx//@version=5
indicator("CrossStyle Pro - Custom Advanced (BTC Short Focus)", shorttitle="CSP-ADV", overlay=true, max_labels_count=500, max_lines_count=300)
// ======================== INPUTS - General ========================
src = input.source(close, "Source")
default_tf = input.timeframe("15", "Default Signal Timeframe (for fixed signals)")
use_fixed_tf = input.bool(true, "Fix Buy/Sell to Timeframe? (recommended for multi-timeframe signals)")
// ========== Cloud / EMA ==========
ema_fast_len = input.int(21, "EMA Fast", minval=1)
ema_slow_len = input.int(55, "EMA Slow", minval=1)
show_gray_cloud = input.bool(true, "Show Gray Cloud")
gray_cloud_color = input.color(color.new(color.gray, 80), "Gray Cloud Color")
// ========== Momentum / MACD / RSI ==========
macd_fast = input.int(12, "MACD Fast")
macd_slow = input.int(26, "MACD Slow")
macd_signal = input.int(9, "MACD Signal")
rsi_len = input.int(14, "RSI Length")
show_rsi_div = input.bool(true, "Plot RSI Divergences (Regular & Hidden)")
div_confirm_bars = input.int(2, "Bars to confirm divergence", minval=1)
// ========== Volume ==========
vol_sma_len = input.int(20, "Volume SMA")
show_volume_signal = input.bool(true, "Use Volume in Signals")
// ========== Signals (sensitivity / noise / smoothing) ==========
sensitivity = input.int(8, "Sensitivity ", minval=1, maxval=50)
noise = input.int(555, "Noise ", minval=1, maxval=1000)
signal_smooth_opt = input.string("Low", "Signal Smoothness", options= )
plot_signals = input.bool(true, "Plot Buy/Sell Labels")
paint_bars = input.bool(true, "Paint Bars Up/Down")
show_top_bottom_reversals = input.bool(true, "Show Top/Bottom Reversals (TR/BR)")
// ========== Market Structure / Swing ==========
show_swings = input.bool(true, "Show Market Structure (swing HH/LL)")
swing_len = input.int(6, "Swing Length (confirmation bars)", minval=1)
market_sr = input.bool(true, "Show Support/Resistance Boxes from swings")
sr_extend_right = input.bool(true, "Extend SR to Right")
// ========== Gaps ==========
show_gaps = input.bool(true, "Detect & Label Gaps")
gap_lookback = input.int(1000, "Bars to Check for Gaps", minval=50)
gap_filled_color = input.color(color.new(color.blue,85), "Filled Gap Color")
gap_unfilled_color = input.color(color.new(color.orange,85), "Unfilled Gap Color")
// ========== Table/UI ==========
show_table = input.bool(true, "Enable Status Table")
table_position = input.string("bottom_right", "Table Position", options= )
table_size = input.string("large", "Table Size", options= )
bull_color = input.color(color.rgb(0,255,150), "Bullish Color")
bear_color = input.color(color.rgb(255,50,50), "Bearish Color")
// ========== Alerts ==========
alert_once_per_bar = input.bool(true, "Alerts: Once Per Bar Close? (recommended)")
// ======================== TIMEFRAME SOURCE HELP ========================
get_src_tf(_expr) =>
use_fixed_tf ? request.security(syminfo.tickerid, default_tf, _expr) : _expr
// ======================== INDICATORS CALC ========================
// EMAs and Gray Cloud
ema_fast = ta.ema(get_src_tf(src), ema_fast_len)
ema_slow = ta.ema(get_src_tf(src), ema_slow_len)
plot_fast = plot(show_gray_cloud ? ema_fast : na, title="EMA Fast", display=display.none)
plot_slow = plot(show_gray_cloud ? ema_slow : na, title="EMA Slow", display=display.none)
if show_gray_cloud
fill(plot_fast, plot_slow, color=gray_cloud_color, title="Gray Cloud")
// MACD
macd_line = ta.ema(get_src_tf(src), macd_fast) - ta.ema(get_src_tf(src), macd_slow)
macd_sig_line = ta.ema(macd_line, macd_signal)
macd_hist = macd_line - macd_sig_line
// RSI
rsi_val = ta.rsi(get_src_tf(src), rsi_len)
// Volume
vol_tf = get_src_tf(volume)
vol_sma = ta.sma(vol_tf, vol_sma_len)
// ======================== DIVERGENCE DETECTION (RSI) ========================
// We implement conservative detection using pivots: compare pivot highs/lows with RSI
pivoth = ta.pivothigh(high, div_confirm_bars, div_confirm_bars)
pivotl = ta.pivotlow(low, div_confirm_bars, div_confirm_bars)
// helper to find last N pivots and compare
var label div_labels = array.new()
// check regular bearish divergence: price makes higher high, RSI lower high
if show_rsi_div and not na(pivoth)
// find previous pivot high
prev_ph_idx = na
prev_ph_val = na
for i = 1 to 50
ph2 = ta.pivothigh(high, div_confirm_bars + i, div_confirm_bars + i)
if not na(ph2)
prev_ph_idx := bar_index - (div_confirm_bars + i)
prev_ph_val := ph2
break
if not na(prev_ph_val)
// current pivot index
cur_ph_idx = bar_index - div_confirm_bars
cur_ph_price = pivoth
// get RSI at those pivots using security to ensure same TF
rsi_prev = request.security(syminfo.tickerid, use_fixed_tf ? default_tf : timeframe.period, ta.valuewhen(ta.pivothigh(high, div_confirm_bars + i, div_confirm_bars + i), rsi_val, 0))
// fallback: sample rsi_val at prev bar approx
rsi_prev := rsi_val
rsi_cur = rsi_val * 0 + rsi_val // fallback: use current RSI (conservative)
// simple check (price HH + RSI lower) -> bearish divergence
// because of complexities across TFs we plot conservative marker on confirmation
// We'll simply detect when price made higher pivot but rsi lower than previous pivot (approx)
// Note: to avoid repainting, plot only after pivot confirmed (pivoth exists)
// We'll do a safe, visual marker only
if cur_ph_price > prev_ph_val and rsi_val < rsi_val
// create label
lab = label.new(cur_ph_idx, cur_ph_price, text="Reg Bear Div", style=label.style_label_down, color=color.new(color.orange,0), textcolor=color.white, size=size.tiny)
array.push(div_labels, lab)
if show_rsi_div and not na(pivotl)
// similar (regular bullish divergence)
prev_pl_idx = na
prev_pl_val = na
for i = 1 to 50
pl2 = ta.pivotlow(low, div_confirm_bars + i, div_confirm_bars + i)
if not na(pl2)
prev_pl_idx := bar_index - (div_confirm_bars + i)
prev_pl_val := pl2
break
if not na(prev_pl_val)
cur_pl_idx = bar_index - div_confirm_bars
cur_pl_price = pivotl
if cur_pl_price < prev_pl_val and rsi_val > rsi_val
lab2 = label.new(cur_pl_idx, cur_pl_price, text="Reg Bull Div", style=label.style_label_up, color=color.new(color.green,0), textcolor=color.white, size=size.tiny)
array.push(div_labels, lab2)
// ======================== SWING & MARKET STRUCTURE ========================
// Use built-in pivot for non-repainting swing identification (confirmed after 'swing_len' bars)
ph_confirm = ta.pivothigh(high, swing_len, swing_len)
pl_confirm = ta.pivotlow(low, swing_len, swing_len)
var float lastSwingHighPrice = na
var int lastSwingHighBar = na
var float lastSwingLowPrice = na
var int lastSwingLowBar = na
if not na(ph_confirm)
lastSwingHighPrice := ph_confirm
lastSwingHighBar := bar_index - swing_len
if not na(pl_confirm)
lastSwingLowPrice := pl_confirm
lastSwingLowBar := bar_index - swing_len
// Plot swing labels
if show_swings
if not na(lastSwingHighPrice)
label.new(lastSwingHighBar, lastSwingHighPrice, text="Swing H", color=color.new(color.blue,0), style=label.style_label_left, textcolor=color.white, size=size.tiny)
if not na(lastSwingLowPrice)
label.new(lastSwingLowBar, lastSwingLowPrice, text="Swing L", color=color.new(color.orange,0), style=label.style_label_left, textcolor=color.white, size=size.tiny)
// SR boxes from last swings
if market_sr and not na(lastSwingHighPrice)
line.new(x1=lastSwingHighBar, y1=lastSwingHighPrice, x2=sr_extend_right ? bar_index + 500 : bar_index, y2=lastSwingHighPrice, color=color.new(color.red,85), width=1, style=line.style_solid)
if market_sr and not na(lastSwingLowPrice)
line.new(x1=lastSwingLowBar, y1=lastSwingLowPrice, x2=sr_extend_right ? bar_index + 500 : bar_index, y2=lastSwingLowPrice, color=color.new(color.green,85), width=1, style=line.style_solid)
// ======================== GAP DETECTION ========================
type gap_t
var table gap_table = na
if show_gaps
// detect simple overnight / time gaps: when today's low > previous high (up-gap) or today's high < previous low (down-gap)
gap_found = false
if high > high and low > high // up gap
gap_found := true
// label
label.new(bar_index, low, text="Unfilled Gap↑", style=label.style_label_left, color=gap_unfilled_color, textcolor=color.white, size=size.tiny)
if low < low and high < low // down gap
gap_found := true
label.new(bar_index, high, text="Unfilled Gap↓", style=label.style_label_left, color=gap_unfilled_color, textcolor=color.white, size=size.tiny)
// filled gaps: when price later crosses the gap zone — marking will be basic (visual)
// ======================== SIGNAL LOGIC (Non-repaint, confirmed on close) ========================
// Base conditions: EMA direction, MACD histogram sign, RSI extremes, Volume
ema_bull = ema_fast > ema_slow
ema_bear = ema_fast < ema_slow
macd_pos = macd_hist > 0
macd_neg = macd_hist < 0
rsi_ok_buy = rsi_val < 85
rsi_ok_sell = rsi_val > 15
vol_up = vol_tf > vol_sma
vol_down = vol_tf < vol_sma
// thresholds using sensitivity/noise
ema_dist = math.abs(ema_fast - ema_slow)
macd_strength = math.abs(macd_hist)
sens = math.max(1, sensitivity)
noise_factor = math.max(1.0, noise / 200.0) // scaled
// combined score
score_buy = (ema_bull ? 1 : 0) + (macd_pos ? 1 : 0) + (rsi_ok_buy ? 1 : 0) + (show_volume_signal and vol_up ? 1 : (show_volume_signal ? 0 : 1))
score_sell = (ema_bear ? 1 : 0) + (macd_neg ? 1 : 0) + (rsi_ok_sell ? 1 : 0) + (show_volume_signal and vol_down ? 1 : (show_volume_signal ? 0 : 1))
cond_buy_base = score_buy >= 3 and macd_hist > (noise_factor * 0.01) and ema_dist > (sens * 0.01)
cond_sell_base = score_sell >= 3 and macd_hist < -(noise_factor * 0.01) and ema_dist > (sens * 0.01)
// smoothing
smooth_len = signal_smooth_opt == "Low" ? 1 : signal_smooth_opt == "Medium" ? 2 : 4
cond_buy_s = ta.sma(cond_buy_base ? 1 : 0, smooth_len) > 0.5
cond_sell_s = ta.sma(cond_sell_base ? 1 : 0, smooth_len) > 0.5
// confirm only after candle close (no repaint)
buy_signal = cond_buy_s and barstate.isconfirmed
sell_signal = cond_sell_s and barstate.isconfirmed
// optionally delay confirmation by 1 candle to be extra-safe (like CrossX)
delay_confirm = input.bool(false, "Delay Signal 1 Candle (extra confirmation)")
if delay_confirm
buy_signal := buy_signal and buy_signal == false ? false : buy_signal
sell_signal := sell_signal and sell_signal == false ? false : sell_signal
// ======================== PLOTTING SIGNALS & STYLING ========================
if paint_bars
barcolor(buy_signal ? bull_color : sell_signal ? bear_color : na)
if plot_signals
plotshape(buy_signal, title="Buy", style=shape.labelup, location=location.belowbar, color=bull_color, text="BUY", textcolor=color.white, size=size.tiny)
plotshape(sell_signal, title="Sell", style=shape.labeldown, location=location.abovebar, color=bear_color, text="SELL", textcolor=color.white, size=size.tiny)
if show_top_bottom_reversals
plotshape(cond_buy_base and ta.cross(ema_fast, ema_slow), title="TopRev", location=location.abovebar, style=shape.triangledown, size=size.small, color=color.new(bull_color,60))
plotshape(cond_sell_base and ta.cross(ema_slow, ema_fast), title="BotRev", location=location.belowbar, style=shape.triangleup, size=size.small, color=color.new(bear_color,60))
// ======================== STATUS TABLE (Dynamic) ========================
var table statTable = na
if show_table
rows = 6
cols = 2
// determine position
pos = table_position == "top_left" ? position.top_left : table_position == "top_right" ? position.top_right : table_position == "bottom_left" ? position.bottom_left : position.bottom_right
// create once
if na(statTable)
statTable := table.new(pos, cols, rows, border_width=1)
// compute cell values
macroEMA = ta.ema(src, 200)
macroSig = macroEMA > macroEMA ? "Bullish" : "Bearish"
curTF = buy_signal ? "Bullish" : sell_signal ? "Bearish" : "Neutral"
mom = macd_hist > 0 ? "Bullish" : macd_hist < 0 ? "Bearish" : "Neutral"
volSig = vol_tf > vol_sma ? "Bullish" : "Bearish"
ms = not na(lastSwingHighPrice) and not na(lastSwingLowPrice) ? (lastSwingHighPrice > lastSwingLowPrice ? "Bullish" : "Bearish") : "Neutral"
// write table
table.cell(statTable, 0, 0, "Indicator", bgcolor=color.black, text_color=color.white)
table.cell(statTable, 1, 0, "Signal", bgcolor=color.black, text_color=color.white)
table.cell(statTable, 0, 1, "Macro Trend")
table.cell(statTable, 1, 1, macroSig, text_color = macroSig == "Bullish" ? color.black : color.white, bgcolor = macroSig == "Bullish" ? bull_color : bear_color)
table.cell(statTable, 0, 2, "Current TF")
table.cell(statTable, 1, 2, curTF, text_color = curTF == "Bullish" ? color.black : color.white, bgcolor = curTF == "Bullish" ? bull_color : curTF == "Bearish" ? bear_color : color.gray)
table.cell(statTable, 0, 3, "Momentum")
table.cell(statTable, 1, 3, mom, text_color = mom == "Bullish" ? color.black : color.white, bgcolor = mom == "Bullish" ? bull_color : mom == "Bearish" ? bear_color : color.gray)
table.cell(statTable, 0, 4, "Volume")
table.cell(statTable, 1, 4, volSig, text_color = volSig == "Bullish" ? color.black : color.white, bgcolor = volSig == "Bullish" ? bull_color : bear_color)
table.cell(statTable, 0, 5, "Market Str.")
table.cell(statTable, 1, 5, ms, text_color = ms == "Bullish" ? color.black : color.white, bgcolor = ms == "Bullish" ? bull_color : ms == "Bearish" ? bear_color : color.gray)
// ======================== ALERTS ========================
if alert_once_per_bar
alertcondition(buy_signal, title="CSP-ADV Buy (Confirmed Close)", message="{{ticker}} — BUY signal (confirmed on close) — TF: " + (use_fixed_tf ? default_tf : timeframe.period))
alertcondition(sell_signal, title="CSP-ADV Sell (Confirmed Close)", message="{{ticker}} — SELL signal (confirmed on close) — TF: " + (use_fixed_tf ? default_tf : timeframe.period))
else
alertcondition(buy_signal and barstate.islast, title="CSP-ADV Buy (Realtime)", message="{{ticker}} — BUY signal (realtime)")
alertcondition(sell_signal and barstate.islast, title="CSP-ADV Sell (Realtime)", message="{{ticker}} — SELL signal (realtime)")
// ======================== NOTES ========================
// - Designed for BTC scalp/timeframes (defaults to 15m). Adjust 'default_tf' if you prefer 1h/4h.
// - Signals are confirmed on candle close (non-repaint) and have optional 1-candle extra delay.
// - Divergence detection is conservative and visual — not an exact replica of CrossX proprietary logic.
// - Test extensively in paper/demo.
// - Use Alerts (create alert, choose this indicator's Buy/Sell condition).

BTC: O Fim da Onda 4 e a Última Dança do ano (+ Visão 2026)Neste gráfico público, apresento a estrutura macro de Ondas de Elliott que estamos rastreando. O Bitcoin está finalizando uma complexa Onda 4 Corretiva, buscando liquidez na confluência da LTA com a extensão de Fibonacci ($84.855).
Meus indicadores proprietários de sentimento e tempo (Time Traveler e ChronoSync) validam matematicamente esta região:
📉 A Zona de Compra (Curto Prazo): A estrutura técnica sugere suporte firme na faixa de $84.800 - $85.000.
Dado Proprietário: Meu algoritmo aponta exaustão vendedora exata na tarde de 30 de Dezembro. A confluência de Preço e Tempo é total para um repique.
🚀 O Alvo (Onda 5 - Janeiro): Projetamos o início da Onda 5 Impulsiva após a virada do ano (dia 01 de janeiro)
Alvo Técnico: Rompimento da LTB buscando $98.000+.
Janela Temporal: Pico de momentum na primeira semana de Janeiro de 01/jan até 05/Jan.
⚠️ ALERTA MACRO (Visão 2026): É crucial notar que este movimento de Janeiro deve ser encarado como uma Alta Momentânea (Topo de Ciclo ou Onda B Macro). As análises de Tempos Gráficos Maiores (Semanal e Mensal) indicam divergências graves. Após este topo de Janeiro, projetamos o início de uma correção profunda ao longo de 2026, com alvos potenciais revisitando $75.000 ou até zonas de $40.000 em um cenário de recessão global. Use a alta de Janeiro para realizar lucros, não para acumular para o longo prazo.
Resumo: O trade é claro: Comprar a limpeza de Dezembro, Vender no topo da euforia de Janeiro.
#Bitcoin #BTC #ElliottWave #AnaliseTecnica #Crypto #BearMarket2026
⚠️ Aviso Legal (Disclaimer): Esta publicação reflete exclusivamente a minha análise técnica pessoal e subjetiva sobre o mercado. O conteúdo aqui apresentado tem caráter puramente educacional e não constitui recomendação de investimento ou consultoria financeira. O mercado de criptomoedas envolve riscos elevados. Faça sempre a sua própria pesquisa (DYOR) antes de tomar qualquer decisão financeira.
🇺🇸 English Version
BTC: Wave 4 Completion & The Last Dance (Setup + 2026 Outlook)
In this public chart, I present the macro Elliott Wave structure we are tracking. Bitcoin is finalizing a complex Corrective Wave 4, hunting for liquidity at the confluence of the trendline and the Fibonacci extension ($84,855).
My proprietary sentiment and timing models (Time Traveler V33) mathematically confirm this pivot zone:
📉 The Setup (Short Term): The visual structure indicates a hard bottom support in the $84,800 - $85,000 range.
Proprietary Insight: My algorithm signals seller exhaustion precisely on the afternoon of December 30th.
🚀 The Target (Wave 5 - January): We project the launch of an Impulsive Wave 5 right after the yearly close.
Technical Target: Breakout towards $98,000+.
Time Window: Momentum peaking in the first week of January (Jan 5th).
⚠️ MACRO WARNING (2026 Outlook): It is critical to understand that this January rally should be viewed as a Temporary Move (Cycle Top or Macro Wave B). Higher Time Frame analysis (Weekly/Monthly) shows severe bearish divergences. Following this January peak, we project a deep correction phase throughout 2026, with potential targets revisiting $75,000 or even the $40,000 zones in a global recession scenario. Treat January as an exit opportunity, not a long-term accumulation zone.
Summary: The strategy is precise: Buy the December flush, Sell the January euphoria.
#Bitcoin #BTC #ElliottWave #TechnicalAnalysis #CryptoTrading #MacroEconomics
⚠️ Disclaimer: This publication reflects solely my personal and subjective technical analysis of the market. The content presented here is for educational purposes only and does not constitute financial investment advice. Cryptocurrency trading involves high risk. Always do your own research (DYOR) before making any financial decisions.

Smart Liquidity Cloud Enhanced Risk management!How to Use SLC+?
SLC+ is very simple to use, but it requires you to pay attention to the confluence of signals
Identify the General Trend:
Look at the price position in relation to the VWAP (yellow) and the color of the HMA (green/red).
Price above the VWAP and green HMA? Uptrend.
Price below the VWAP and red HMA? Downtrend.
Keep an Eye on Liquidity Zones:
The orange zones are areas where the price usually reacts. Wait for the price to approach these zones to look for signals.
Wait for the Signals:
Buy: Green arrow + green cloud (accumulation) + white background (high volume activity).
Sell: Red arrow + red cloud (reversal) + white background.
Only enter if there is confluence: signal, cloud and high volume.
Enter the Trade:
Buy: Enter when the green arrow appears, with a stop-loss just below the lower liquidity zone.
Sell: Enter when the red arrow appears, with a stop-loss just above the upper liquidity zone.
Target: Target the next liquidity zone or a relevant support/resistance.
Manage Risk:
Risk 1-2% per trade, adjusting position size based on stop-loss. (in shorter time frames such as (5m, 15m and 1h)
In longer time frames I suggest analyzing the asset's past to get a better idea or wait for the price to return and close a candle inside the orange cloud! (4h, 1D and 1W).
Avoid trading in sideways markets (ADX < 20).
Best Chart Time Frames
Trends (Swing Trade): 4h or 1D. These time frames are great for capturing big smart money movements, with less noise.
Reversals (Day Trade): 1h or 15m. Perfect for catching quick turns, such as accumulations or divergences.
Tip: If the market is very sideways (ADX < 20), wait or use longer time frames (4h, 1D) to avoid false signals.
Practical Example
Imagine that you are on the 1h chart:
The price is approaching the lower liquidity zone (orange).
The HMA is green, and the price is above VWAP – uptrend.
Suddenly, a green arrow appears, the cloud turns green (accumulation), and the background turns white (high volume).
You enter long, place the stop-loss just below the liquidity zone and target the next liquidity zone.
The price goes up, and you close the trade with a profit!
Avoid Sideways Markets: If the ADX is below 20, the market has no direction. Wait for a clearer movement.
Adjust the Parameters: If you trade on shorter time frames (e.g.: 5m), try reducing the HMA Length to 9 and the VWAP Length to 20.
Risk Management: Always use stop-loss and do not risk more than 1-2% per trade.
Why is SLC+ Different?
Advanced Confluence: Combines price, volume, volatility (ATR) and trend strength (ADX) to give you more reliable signals.
Intuitive Visual: Zones, clouds and signals are easy to understand, even for beginners.
Based on Smart Money: Liquidity zones and clouds show you where the big players are operating.
Reduces False Signals: The integrated Phoenix Ascending filters out bad signals, requiring confluence.
Important Notice
SLC+ is a tool to help you with your analysis, but it is not a crystal ball. Always use risk management and combine it with your own analysis. The market is unpredictable, so operate responsibly!
Screen time is everything! Test before raising your hand and have a good trading plan! If you understand this indicator, you have everything to be consistent! And don't be greedy! Many times you will sell and the price may still go up but will soon reverse, if you correctly follow the confluence between SLC and PHXA+!

Siacoin. Uma boa aposta.:fire: SC / USD, D, Poloniex - O preço está em uma região de suporte (linha azul), rsi e stoch indicando divergência de alta forte. OBV estável em todo o período de queda (seta rosa). Temos que acreditar nela e comprar. Para posição de longo prazo, olhar para o teste de topo na linha vermelha. Vamos dar um alerta de compra em Siacoin no patamar de preço em que está para buscar 20% e 100%.
:fire: SC / USD, D, Poloniex - The price is in a support region (blue line), rsi and stoch indicating strong high divergence. Stable OBV throughout the fall period (pink arrow). We have to believe in it and buy it. For long term position, look for the top test in the red line. We will give a buy alert in Siacoin at the price level in which it is to look for 20% and 100%.
:fire: # SC / USD, D, Poloniex - The price is in a support region (blue line), rsi and stoch indicating strong high divergence. Stable OBV throughout the fall period (pink arrow). We have to believe in it and buy it. For long term position, look for the top test in the red line. We will give a buy alert in Siacoin at the price level in which it is to look for 20% and 100%.

Fim do rali de baixa no BTC?Investidores no mercado de criptomoedas estão sempre em busca de informações valiosas que possam ajudá-los a tomar decisões informadas e lucrativas. Um dos indicadores técnicos mais utilizados neste mercado é o MACD , ou Moving Average Convergence Divergence.
O MACD é uma ferramenta de análise técnica que ajuda a identificar tendências, pontos de entrada e saída e momentum do ativo. É composto por duas linhas, uma linha MACD e uma linha de sinal, que se cruzam em determinados pontos.
Divergências baixistas são consideradas sinais de fraqueza do ativo e podem indicar uma tendência de baixa. Em 8 de novembro de 2021, foi formada uma divergência baixista no MACD histograma do Bitcoin no gráfico semanal, o que resultou em uma queda no preço da criptomoeda desde então.
No entanto, agora estamos vendo uma divergência altista no MACD histograma do Bitcoin , o que pode ser um sinal de que a força do ativo está aumentando e que uma tendência de alta está se formando. Divergências altistas são consideradas sinais de força do ativo e podem indicar uma tendência de alta.
Além da divergência no MACD histograma , há outros fatores que suportam a ideia de uma tendência de alta para o Bitcoin . A institucionalização da criptomoeda continua aumentando, com empresas como Tesla e PayPal recentemente adotando o Bitcoin em suas estratégias financeiras. Além disso, o aumento da adesão à criptomoeda como um ativo de reserva e a expectativa de uma inflação global devido a medidas de estímulo econômico podem ser fatores que impulsionam a demanda por criptomoedas, incluindo o Bitcoin .
No entanto, é importante lembrar que o mercado de criptomoedas é altamente volátil e incerto, e não há garantias de que o preço do Bitcoin vá realmente subir. É importante realizar sua própria análise e pesquisa antes de tomar qualquer decisão de investimento, e sempre manter uma gestão de risco adequada.
Lembrando que esse poste é educacional e não configura dicas de investimento.

Divergência altista forte no diárioAliado aos sinais que destaquei na minha ultima análise do BTC (Link abaixo), o indicador Vumanchu Cipher B + Divergences acabou de printar no diário uma divergência que implica na perda de força da queda e que foram ótimos sinais que antecederam movimentos fortes no passado, eu considero um sinal de divergência no Vumanchu muito forte... se vcs colocarem ele no BTCUSDT semanal verá que ele printou uma divergência quando rompemos a máxima histórica nos 69k. esse pra mim foi um forte gatilho de entrada aliado à minha outra analise e montei posição ;)

Dolar - Estrutura de Alta Antes de Retomada da QuedaO indicador Dollar Shadow aponta tendência de baixa. Nunca esteve tão estresado como mostra o Dollar Divergence.
No Entanto estrutura de alta, swing ABC, deve se formar antes de queda retomar.
Alvo final em 4,60.
Quem quiser usar a Suíte de indicadores do Dollar shadow chama na DM.

VETUSDT FUTURES 08-01-21Preço fez pullback no 0.618
a mostrar hidden bullish divergences mas ainda nao estao confirmadas
rejeitou o suporte e fez um engulfing na subida

