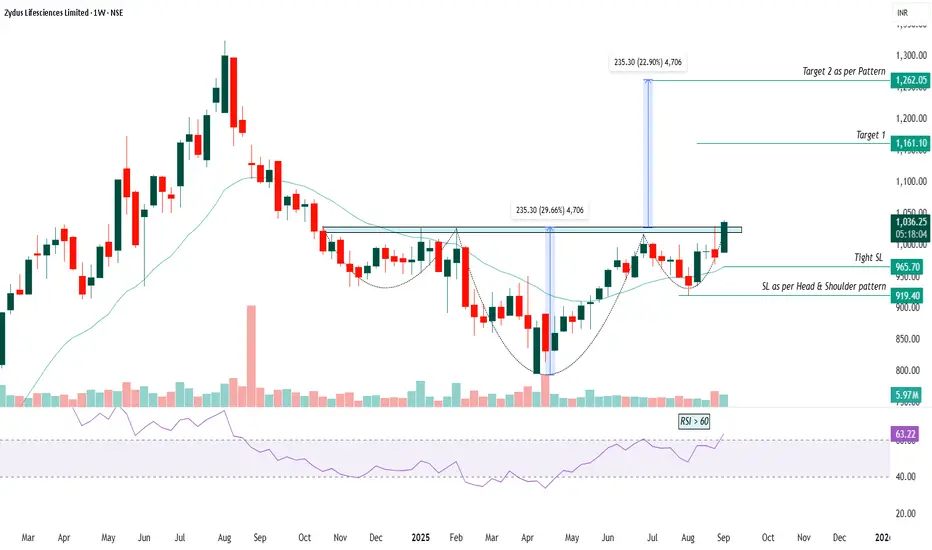
1. The chart shows Zydus Lifesciences Limited on a weekly timeframe with recent bullish momentum, closing at 1036.85 INR.
2. A clear inverse head and shoulders pattern is marked, indicating a possible trend reversal from downtrend to uptrend.
3. The neckline resistance has been broken, confirming the pattern and suggesting potential upside movement.
4. Two targets are marked as per the pattern, with Target 1 at 1161.10 INR and Target 2 at 1262.05 INR.
5. Potential stop-loss levels are specified: a "tight SL" near 965.70 and a traditional pattern-based SL at 919.40.
6. Volume and RSI indicators show increased buying strength, with RSI above 60 signifying bullish momentum.
7. The breakout height (235.30) is projected upwards from the neckline for target calculation.
Educational disclaimer: This analysis is for educational purposes only and does not constitute financial advice; always do independent research before making investment decisions
Aviso legal
As informações e publicações não devem ser e não constituem conselhos ou recomendações financeiras, de investimento, de negociação ou de qualquer outro tipo, fornecidas ou endossadas pela TradingView. Leia mais em Termos de uso.
Aviso legal
As informações e publicações não devem ser e não constituem conselhos ou recomendações financeiras, de investimento, de negociação ou de qualquer outro tipo, fornecidas ou endossadas pela TradingView. Leia mais em Termos de uso.