ZEC/USDT – Symmetrical Triangle Reaching Apex
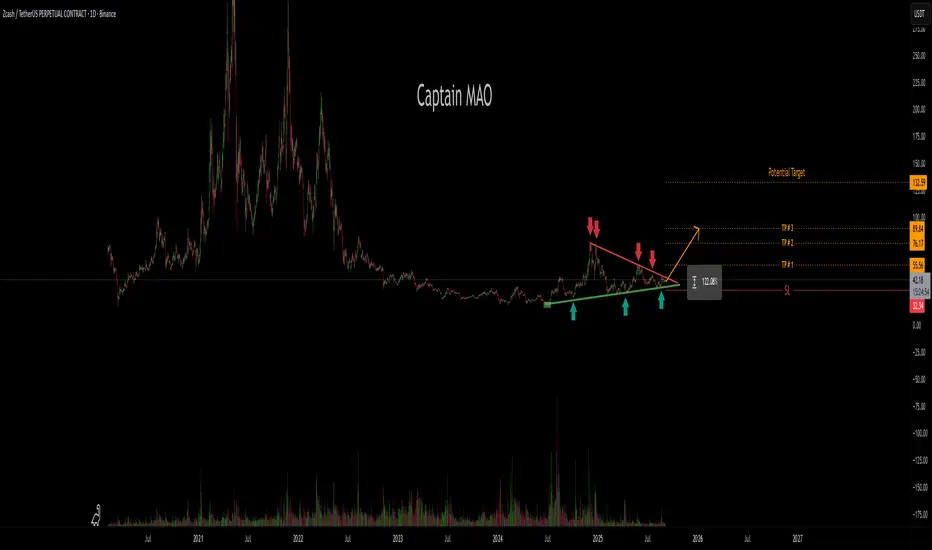
For the past 9+ months, ZEC/USDT has been in a prolonged correction and consolidation phase, forming a huge symmetrical triangle pattern. This structure reflects a balance between buyers and sellers, with volatility compressing as price coils tighter toward the apex of the triangle.
Price action is now approaching a decisive point. According to the 5th-touch breakout rule, the 5th attempt to test trendline support or resistance often results in a make-or-break breakout.
If buyers seize control, a confirmed breakout above the triangle could trigger a powerful expansion move. Conversely, failure to hold the apex level could result in a downside continuation.
Nota
111% so far TP1&TP#2 hiNota
TP#3 132% Trade fechado: objetivo atingido
Boom 248% all take profit price hit time to rest 🧠 8+ yrs in crypto & Forex | ⚡ Scalp & swing trader | 📊 Price action lover | 🎯 Hunting setups daily ✅
Aviso legal
The information and publications are not meant to be, and do not constitute, financial, investment, trading, or other types of advice or recommendations supplied or endorsed by TradingView. Read more in the Terms of Use.
🧠 8+ yrs in crypto & Forex | ⚡ Scalp & swing trader | 📊 Price action lover | 🎯 Hunting setups daily ✅
Aviso legal
The information and publications are not meant to be, and do not constitute, financial, investment, trading, or other types of advice or recommendations supplied or endorsed by TradingView. Read more in the Terms of Use.