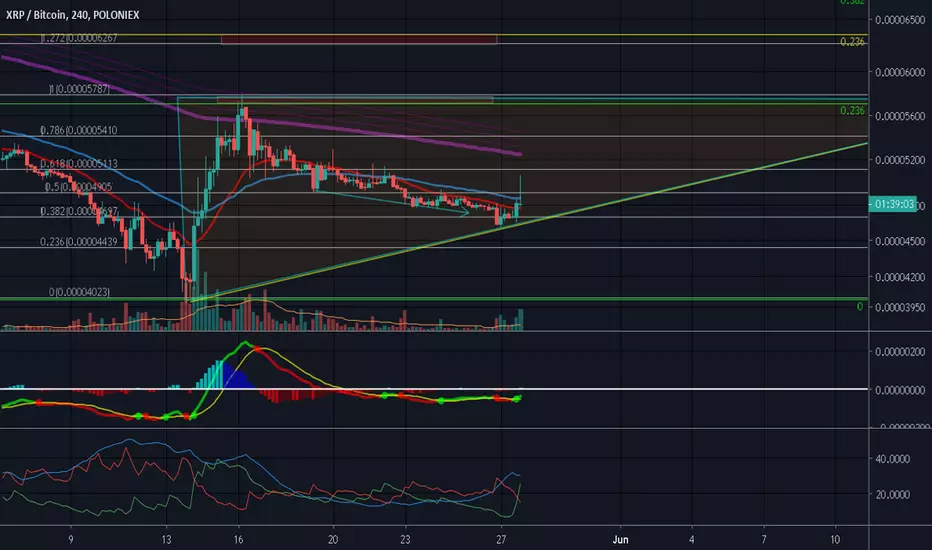
Inverse from xrp/usd. XRP/BTC is suffered from down fall from december 2018 until recently it's pump a while above 50 EMA and i believe due to btc dominance spike down below trendline i drew before..

as if right now btc dominance back above the trendline, btc/xrp comeback again from 5000 satoshi to 4800 satoshi as the time i write this post.
4 hour indicator:
DMI : -DMI(red line) is down and +DMI (green line) is spike upward while it's just momentary as DMX (blue) still flat out showing trend is not develop yet to confirm the bullish trend until the DMX line is begin to move up.

MACD:
MACD is show a good sign for bullish trend to develop as the buyer volume is appearing, MACD EMA already crossing creating a buy signal.

Volume MA Is still flat although there's good buy volume in recent volume histogram.
EMA is still within bearish area as it's still below 200 EMA line. though the recent minor pump manage to get above 20 EMA line. potential shooting star candle also showing in recent candle as it's a bearish sign
In my opinion. the bullish sign is beginning to show from indicators while it must be confirmed from other chart such as btc.d dominance below 59% to start it's strong rally. as i didnt believe for xrp/btc after most recent pump to 200 EMA and fail down lower and always tend to go lower if btc dominance keep going up .
the positive sign is the price action manage to made a higher low in 4 hour chart for now.

on 1 day chart
just get rejected by 20 EMA for now,
DMI: nothing interesting as -DMI and +DMI is consolidating within a tight range and DMX is low level which is indicate a sideway action/low volatility/slow decline price as no liquidity in this market yet.

MACD : there's a petty buyer volume appear instead of seller volume.

Volume MA is neutral
In my opinion, for 1 day it's nothing interesting happen. as btc dominance dictate most altcoin and need to keep an eye on it.
same things also like 4 hour chart. the price action did manage to create a higher low for now, if the price action could manage established along the recent trend line might a potential ascending triangle is forming which is a good sign for bullish trend.

please take this idea as a grain of salt as reality always differ from what i expect as this post merely just an opinion.
and please feel free to share what your thought on comment section as i like to hear a new things to learn from you too..
peace.
as if right now btc dominance back above the trendline, btc/xrp comeback again from 5000 satoshi to 4800 satoshi as the time i write this post.
4 hour indicator:
DMI : -DMI(red line) is down and +DMI (green line) is spike upward while it's just momentary as DMX (blue) still flat out showing trend is not develop yet to confirm the bullish trend until the DMX line is begin to move up.
MACD:
MACD is show a good sign for bullish trend to develop as the buyer volume is appearing, MACD EMA already crossing creating a buy signal.
Volume MA Is still flat although there's good buy volume in recent volume histogram.
EMA is still within bearish area as it's still below 200 EMA line. though the recent minor pump manage to get above 20 EMA line. potential shooting star candle also showing in recent candle as it's a bearish sign
In my opinion. the bullish sign is beginning to show from indicators while it must be confirmed from other chart such as btc.d dominance below 59% to start it's strong rally. as i didnt believe for xrp/btc after most recent pump to 200 EMA and fail down lower and always tend to go lower if btc dominance keep going up .
the positive sign is the price action manage to made a higher low in 4 hour chart for now.
on 1 day chart
just get rejected by 20 EMA for now,
DMI: nothing interesting as -DMI and +DMI is consolidating within a tight range and DMX is low level which is indicate a sideway action/low volatility/slow decline price as no liquidity in this market yet.
MACD : there's a petty buyer volume appear instead of seller volume.
Volume MA is neutral
In my opinion, for 1 day it's nothing interesting happen. as btc dominance dictate most altcoin and need to keep an eye on it.
same things also like 4 hour chart. the price action did manage to create a higher low for now, if the price action could manage established along the recent trend line might a potential ascending triangle is forming which is a good sign for bullish trend.
please take this idea as a grain of salt as reality always differ from what i expect as this post merely just an opinion.
and please feel free to share what your thought on comment section as i like to hear a new things to learn from you too..
peace.
Aviso legal
As informações e publicações não devem ser e não constituem conselhos ou recomendações financeiras, de investimento, de negociação ou de qualquer outro tipo, fornecidas ou endossadas pela TradingView. Leia mais em Termos de uso.
Aviso legal
As informações e publicações não devem ser e não constituem conselhos ou recomendações financeiras, de investimento, de negociação ou de qualquer outro tipo, fornecidas ou endossadas pela TradingView. Leia mais em Termos de uso.