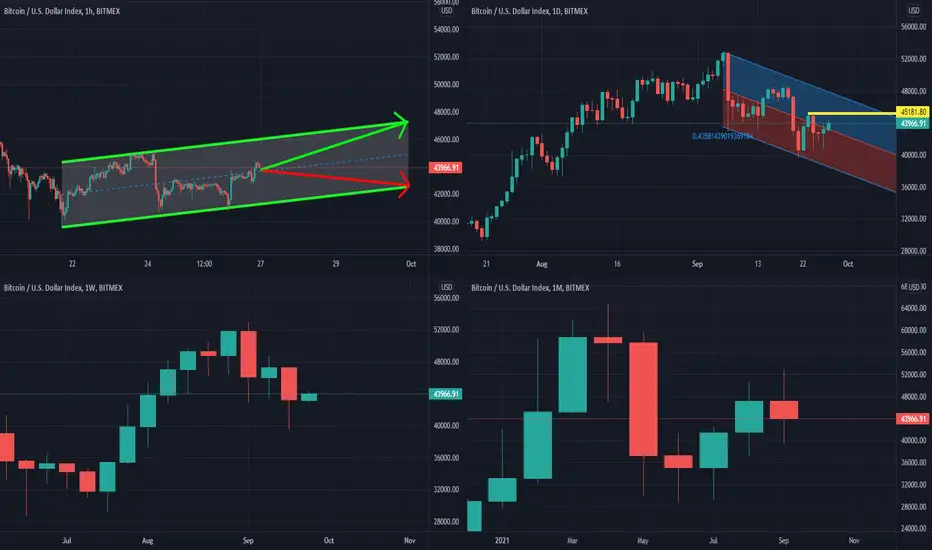
Multi-Timeframe Analysis:
Hourly Chart: Bearish Flag (Neutral)-(Bearish)
Daily Chart: At the middle of a Downward regression channel (Neutral)-(Bearish)
Weekly Chart: after 7 bullish week we see sellers overwhelmed buyers in the past 4 weeks!
Monthly Chart: spinning Doji (Neutral)
Conclusion: This week will be a Neutral
Hourly Chart: Bearish Flag (Neutral)-(Bearish)
Daily Chart: At the middle of a Downward regression channel (Neutral)-(Bearish)
Weekly Chart: after 7 bullish week we see sellers overwhelmed buyers in the past 4 weeks!
Monthly Chart: spinning Doji (Neutral)
Conclusion: This week will be a Neutral
Use the following link to access trading ideas: patreon.com/SniperTraderStocks?utm_medium=unknown&utm_source=join_link&utm_campaign=creatorshare_creator&utm_content=copyLink
Aviso legal
As informações e publicações não devem ser e não constituem conselhos ou recomendações financeiras, de investimento, de negociação ou de qualquer outro tipo, fornecidas ou endossadas pela TradingView. Leia mais em Termos de uso.