Gold (XAU/USD) continues its remarkable bullish run in 2025, driven by persistent geopolitical tensions, central bank buying, a weakening US dollar, and expectations of further Federal Reserve rate cuts. As of today, the spot price stands at approximately $3,685 per ounce, marking a 1.06% increase from the previous day and a staggering 40.47% year-over-year gain. This follows a 26% rise in the first half of the year and nearly 41% year-to-date, with the metal recently touching an all-time high near $3,707 earlier this month. The market remains in a structural uptrend, though short-term volatility—exacerbated by the recent FOMC meeting—has led to some profit-taking and consolidation.
Technical Analysis
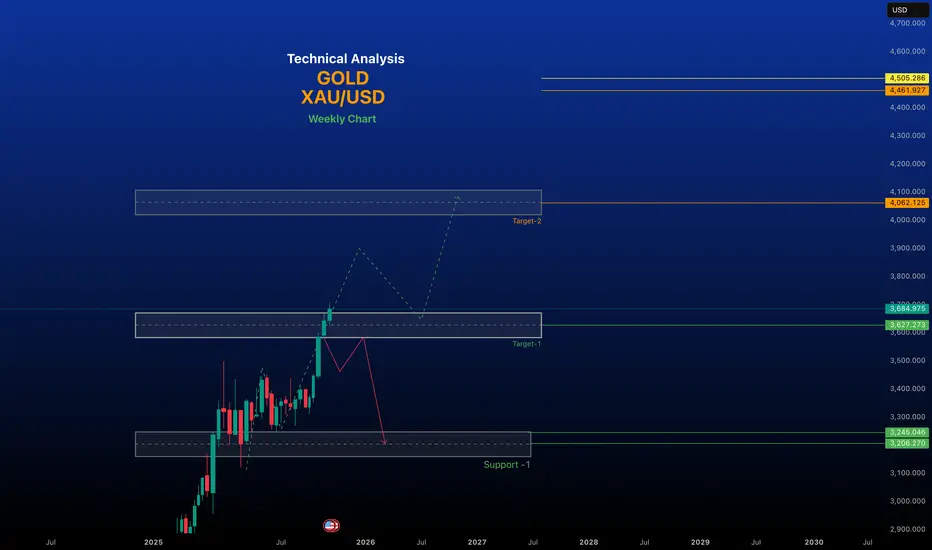
Gold's chart on the daily and H1 timeframes shows a bullish bias, with the price trading above key moving averages (50-day MA at $3,520 and 200-day MA at $3,200). The recent pullback from $3,707 appears corrective, testing demand zones around $3,638-$3,644 where buyers stepped in aggressively.Key Support Levels:Immediate: $3,644–$3,638 (recent demand zone; strong buying interest here).
Long term Support and resistance
Support : $3,525–$3,580
Key Resistance Levels: $3,900 - $4,000
Trend Bullish
~~ Disclaimer ~~
This analysis is based on recent technical data and market sentiment from web sources. It is for informational \ educational purposes only and not financial advice. Trading involves high risks, and past performance does not guarantee future results. Always conduct your own research or consult a SEBI-registered advisor before trading.
# Boost and comment will be highly appreciated.
Technical Analysis
Gold's chart on the daily and H1 timeframes shows a bullish bias, with the price trading above key moving averages (50-day MA at $3,520 and 200-day MA at $3,200). The recent pullback from $3,707 appears corrective, testing demand zones around $3,638-$3,644 where buyers stepped in aggressively.Key Support Levels:Immediate: $3,644–$3,638 (recent demand zone; strong buying interest here).
Long term Support and resistance
Support : $3,525–$3,580
Key Resistance Levels: $3,900 - $4,000
Trend Bullish
~~ Disclaimer ~~
This analysis is based on recent technical data and market sentiment from web sources. It is for informational \ educational purposes only and not financial advice. Trading involves high risks, and past performance does not guarantee future results. Always conduct your own research or consult a SEBI-registered advisor before trading.
# Boost and comment will be highly appreciated.
renderwithme
Aviso legal
As informações e publicações não devem ser e não constituem conselhos ou recomendações financeiras, de investimento, de negociação ou de qualquer outro tipo, fornecidas ou endossadas pela TradingView. Leia mais em Termos de uso.
renderwithme
Aviso legal
As informações e publicações não devem ser e não constituem conselhos ou recomendações financeiras, de investimento, de negociação ou de qualquer outro tipo, fornecidas ou endossadas pela TradingView. Leia mais em Termos de uso.