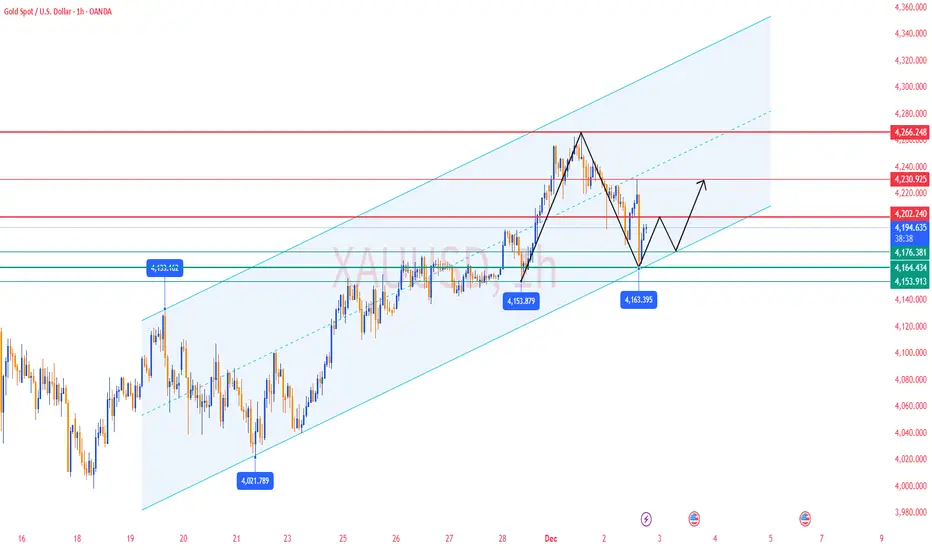
✅ During today’s U.S. session, gold dipped to a low of 4163 and then strongly rebounded to around 4195.
➡️ This indicates two key points:
1️⃣ 4163 has been confirmed as the short-term bottom of this downward move (strong support validated)
2️⃣ Buyers absorbed positions near the key support zone → rebound momentum is recovering
Gold has shifted from a “sharp decline / weak structure” into a “bottoming rebound pattern.”
✅ 4H Chart (H4) Trend Analysis
1️⃣ Signs of the high-level correction coming to an end
Gold corrected down from the 4264 high and reached a low of 4163.
The latest H4 candle shows a long lower wick, reflecting strong buying pressure and indicating that bulls have begun to defend.
2️⃣ Bollinger Bands Structure
Price has rebounded from below the middle band back above it → short-term bearish pressure is easing
Lower band at 4143 was not touched
Middle band (≈4202) is currently the key resistance & reversal level
➡️ If gold reclaims the Bollinger middle band at 4202, H4 will return to a strong bullish rhythm.
3️⃣ Moving Averages
MA5 and MA10 are pointing downward → short-term correction continues
But MA20 (≈4200–4202) is still sloping upward → the medium-term bullish structure remains intact
Current price is right under the MA20 resistance zone
➡️ 4200–4202 = the key reversal confirmation level for H4.
✅ 1H Chart (H1) Trend Analysis
1️⃣ Downtrend channel interrupted by a “strong lower wick”
Gold printed a significant lower shadow at 4163, signaling a classic “bottoming rejection.”
2️⃣ Moving Averages
Price has moved back above MA5 and MA10 → bearish momentum weakening
MA20 (≈4210) is still capping the rebound
➡️ A break above MA20 would flip H1 back into a bullish short-term structure.
3️⃣ Bollinger Bands Structure
Lower band (≈4176) was tested and price bounced sharply → strong support
Middle band (≈4210) is the short-term bullish breakout level
🔴 Resistance Levels: 4200–4202 / 4230–4234 / 4250–4256
🟢 Support Levels: 4185–4180 / 4175 / 4163
✅ Trading Strategy Reference
🔰 Main Strategy: Buy on Pullbacks (Trend intact, buy dips)
Current price around 4195 is part of the early rebound phase.
“Steady buyers” should watch two signals:
🔍 Signal 1: Ability to hold above 4202 (H4 reversal level)
🔍 Signal 2: Break above 4210 (H1 middle band)
🟠First Buy Zone: 4185–4180 (short-term support)
If price retests and holds, consider light long positions
🎯 Targets: 4205 / 4215 / 4234
⛔ Stop-loss: below 4170
🟠Second Buy Zone: 4175–4165 (strong support zone)
This area is the “institutional absorption zone.”
If tested again and holds, it becomes an excellent medium-term long entry.
🎯 Targets: 4205 / 4234 / 4250
⛔ Stop-loss: below 4155
🔰 Secondary Strategy: Short on Rejections (short-term only)
Even though price has rebounded, key resistance has not yet been broken, so shorting rejections remains a short-term strategy:
🟠First Sell Zone: 4202–4210
Short lightly if any of the following appear:
▪ Long upper wick
▪ Bearish 1H candle
▪ Weak breakout with low volume
🎯 Targets: 4185 / 4175
⛔ Stop-loss: above 4220
🟠Second Sell Zone: 4234–4250
(strong resistance, suitable for high-level shorts)
🎯 Targets: 4205 / 4180
⛔ Stop-loss: above 4262
✅ Trend Summary
1️⃣ 4163 = confirmed short-term bottom of this correction
2️⃣ Gold is currently in a bottoming rebound structure
3️⃣ 4202–4210 = must-break resistance zone for short-term bulls
4️⃣ Break above 4210 → gold turns strong again, targeting 4234 / 4250
5️⃣ Break below 4175 → gold may retest 4163, or even drop toward 4150
6️⃣ Medium-term bullish structure remains intact; the market has only completed a necessary technical correction
✅ 𝐃𝐚𝐢𝐥𝐲 𝟐-𝟒 𝐓𝐫𝐚𝐝𝐢𝐧𝐠 𝐒𝐢𝐠𝐧𝐚𝐥𝐬 🔥
✅ 𝐇𝐢𝐠𝐡 𝐀𝐜𝐜𝐮𝐫𝐚𝐜𝐲 𝟗𝟎%-𝟗𝟓% 🔥
✅ 𝐌𝐨𝐧𝐭𝐡𝐥𝐲 𝐏𝐫𝐨𝐟𝐢𝐭 𝟑𝟓𝟎𝟎 𝐏𝐈𝐏𝐒 🔥
💎 𝐏𝐫𝐨𝐟𝐞𝐬𝐬𝐢𝐨𝐧𝐚𝐥 𝐅𝐫𝐞𝐞 𝐆𝐫𝐨𝐮𝐩:t.me/+YgFaky2XQ7ViYWE9
✅ 𝐇𝐢𝐠𝐡 𝐀𝐜𝐜𝐮𝐫𝐚𝐜𝐲 𝟗𝟎%-𝟗𝟓% 🔥
✅ 𝐌𝐨𝐧𝐭𝐡𝐥𝐲 𝐏𝐫𝐨𝐟𝐢𝐭 𝟑𝟓𝟎𝟎 𝐏𝐈𝐏𝐒 🔥
💎 𝐏𝐫𝐨𝐟𝐞𝐬𝐬𝐢𝐨𝐧𝐚𝐥 𝐅𝐫𝐞𝐞 𝐆𝐫𝐨𝐮𝐩:t.me/+YgFaky2XQ7ViYWE9
Aviso legal
As informações e publicações não se destinam a ser, e não constituem, conselhos ou recomendações financeiras, de investimento, comerciais ou de outro tipo fornecidos ou endossados pela TradingView. Leia mais nos Termos de Uso.