Analysis and Strategy for the Latest Gold Trend on September 5:
I. Fundamental Analysis
The gold market is currently at a critical crossroads after reaching a historic high. Market sentiment is primarily driven by two key factors: the ebb and flow of safe-haven demand and the interplay between the US dollar and Federal Reserve policy expectations. Today's release of the US August non-farm payroll data (NFP) will be a key catalyst in determining the short-term direction.
US Dollar and Interest Rate Expectations: Everything Await Non-Farm Payrolls
Data Focus: This non-farm payrolls report is one of the most important economic indicators ahead of the Federal Reserve's September meeting. The market will use it to gauge the health of the US labor market and speculate on the Fed's monetary policy path.
II. Technical Analysis
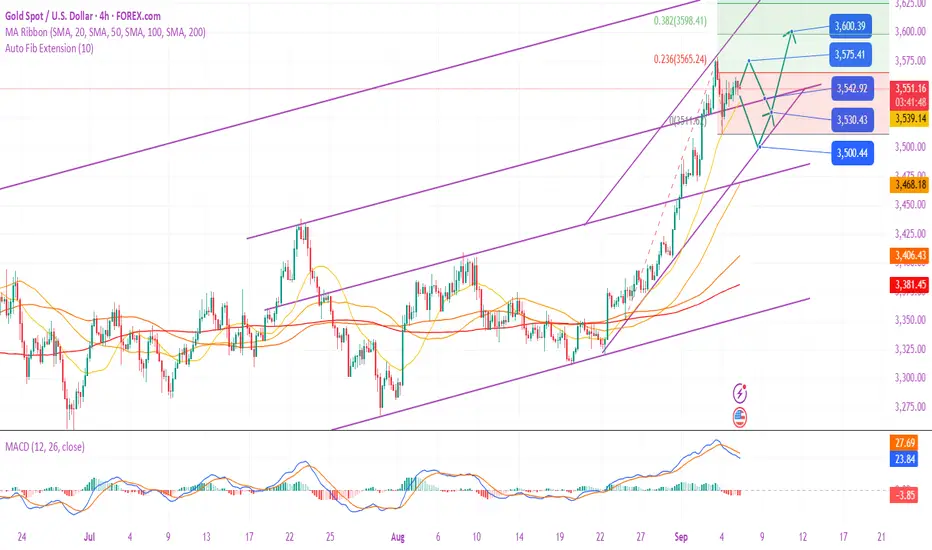
Trend Positioning: The long-term and primary trend is undoubtedly bullish. After breaking through the historical high, gold prices experienced a sharp one-day correction, but the overall upward structure was not destroyed.
Key Price Level Analysis:
Upside Resistance:
Short-term resistance: $3,568-3,578/oz. This represents the high point of yesterday's rebound and represents the path for gold prices to reach new all-time highs. Historical Highs/Strong Resistance: $3,600 and above (this week's all-time high).
Support Below:
Bull Lifeline: $3,530-3,520/oz. This represents the low of yesterday's pullback and is also the middle Bollinger Band on the 4-hour chart and key trend support. If this area is intact, the bull trend is intact.
Strength Dividing Point: $3,510/oz. The report clearly states that this level is a "critical strength and weakness point." A break below this level would signal a potential phased shift in the current uptrend, with gold potentially seeking deeper support (such as the 3,480-3,450 area).
III. Comprehensive Analysis and Trading Strategy
Core View: The trend is bullish, but short-term fluctuations are entirely dependent on the non-farm payroll data. The operation is mainly based on following the trend and buying low, but strict risk control is required to guard against unexpected fluctuations caused by data.
Strategy 1: Before the Non-Farm Payroll Data Release (Light Position or Wait and See)
It is recommended to place a light long position in the 3530-3525 area, with a stop-loss below 3510 (e.g., 3505), and target the 3560-3570 area.
If the gold price rebounds directly to the 3565-3575 area, a light short position can be tried with a small stop-loss (e.g., 3585), targeting 3540-3530 (taking advantage of a technical pullback before the data).
Strategy 2: Trend-following Trading After the Non-Farm Payroll Data Release (Main Strategy)
Scenario A: The data is bullish for gold (actual value < 73,000)
Operation: A pullback is a long opportunity. You can enter the market and go long when the gold price first falls back to the 3550-3540 area. Stop-loss: Below 3530.
Target: 3575 → 3590 → all-time high.
Scenario B: Data negative for gold (actual value > 75,000)
Action: Don't rush to short. Monitor gold's testing of key support levels. If the gold price falls rapidly and hits the strong support area of 3520-3510 for the first time, you can try to take long orders to test the bottom and rebound.
Stop-loss: Must be set below 3505.
Target: 3540-3550 on a rebound.
Note: If gold prices fall strongly below 3510 and fail to rebound, abandon long positions and switch to a rebound short strategy, targeting 3480-3450.
Scenario C: Data neutral (actual value between 73,000-75,000)
Operation: The market may react flatly, continuing technical volatility. We recommend buying low and selling high with
Risk Warning:
Non-farm payroll data can be volatile, so it's crucial to manage your positions and avoid excessive initial positions.
Market liquidity may plummet immediately after the data is released, leading to widening spreads and increased slippage risk. Limit orders are recommended over market orders.
Regardless of the data's direction, the gains and losses of the two key points of 3510 and 3575 will be the most important indicator for determining intraday strength.
Trade ativo
September 8 Gold Trend Analysis and Trading Strategy:
Strong market expectations of a Fed rate cut pushed gold prices to a record high. Technical overbought signals suggest increased short-term volatility.
1. Fundamental Analysis
Weak non-farm payroll data: US non-farm payrolls increased by only 22,000 in August, far below market expectations of 75,000, and the June figure was revised downward to -13,000. The unemployment rate rose to 4.3%, the highest level since 2021, indicating a significant deterioration in the labor market.
Rate Cut Expectations Strengthened: Weak non-farm payroll data has significantly increased market expectations for a Fed rate cut in September. Current futures market pricing indicates a near-100% probability of a 25 basis point rate cut in September, with an even approximately 10% chance of a 50 basis point cut.
The US dollar and US Treasury yields fell: Following the release of the non-farm payroll data, the US dollar index fell nearly 0.6% to 97.74; the US 10-year Treasury yield fell over 8.5 basis points to 4.076%, providing strong support for gold prices.
Risk Factors: Despite rising expectations for rate cuts, inflationary pressures have not completely subsided. Price uncertainty caused by Trump's tariff rhetoric may limit the Fed's pace of easing. An unexpectedly higher CPI data next week could limit the extent of rate cuts.
2 Technical Analysis
Daily Chart: Gold closed lower for the first time after seven consecutive days of gains, but this is typically a single-day correction. The 5-day moving average has moved up to the 3550-3545 area, becoming a key support level. As long as gold prices hold this level, the strong unilateral upward trend will remain unchanged.
4-Hour Chart: The middle Bollinger Band (3555 area) provides important support. A break above this level will maintain a relatively strong trend; a break could trigger a periodic pullback.
Technical indicators: The relative strength index (RSI) is in overbought conditions, indicating that there may be a risk of a technical pullback in the short term.
Key Levels:
Resistance: $3,600-3,610 (round-number level + historical high)
Support: $3,570-3,560 (recent swing low), $3,550-3,545 (5-day moving average)
Next Week's Forecast
Based on a comprehensive analysis of fundamentals and technicals, gold is likely to maintain its strong performance next week, but a technical correction is possible. The market will closely watch the CPI data released next week, which will provide more clues on the Fed's policy path.
4. Trading Strategy Recommendations:
Short-term traders can adopt a strategy of "primarily buying on dips, supplemented by selling on rebounds":
Long Opportunities: Consider going long when gold prices stabilize at the 3570-3560 support level, with a target of 3600-3610 and a stop-loss below 3550.
Short Opportunities: Consider going short when gold prices rebound to the 3600-3610 resistance level, with a target of 3580 and a stop-loss above 3620.
Medium- to long-term investors should continue to hold long gold positions, and any technical pullbacks should be considered as opportunities to increase their holdings. The gold bull market is not over, and the possibility of gold reaching a new all-time high in 2025 remains high.
Risk control is crucial:
Avoid excessive leverage.
Set a reasonable stop-loss (exit long positions if the price falls below $3540).
5. Conclusion
The gold market has entered a sensitive zone after reaching a new all-time high. Given the intertwined bullish and bearish factors, be wary of high volatility risks. The overall trend remains bullish, but there may be short-term fluctuations due to technical overbought and high valuations. Any pullback can be seen as a buying opportunity, with a focus on the performance of the 3550-3555 support area.
❤️Free gold trading signals:t.me/+OJSbWQ6F4KM2Mzk1
💥Gold trading analyst | Technology + logic dual drive
💯Intraday/band strategy analysis | Risk control first, win in stability
💥Gold trading analyst | Technology + logic dual drive
💯Intraday/band strategy analysis | Risk control first, win in stability
Publicações relacionadas
Aviso legal
As informações e publicações não devem ser e não constituem conselhos ou recomendações financeiras, de investimento, de negociação ou de qualquer outro tipo, fornecidas ou endossadas pela TradingView. Leia mais em Termos de uso.